
Fecha: junio 2025
Francisco Rodríguez Fernández*
Financial literacy, PISA 2022, cognitive disadvantage, socio-economic status, financial education.
Abstract
This paper proposes a multidimensional typology of disadvantage –cognitive, structural, and situational– to better understand disparities in adolescent financial literacy. Using data from the OECD-PISA 2022 Financial Literacy module (N = 97,983 students across 20 countries), we construct standardized indices to capture each disadvantage type and estimate their effects through weighted regressions and machine learning. Our results show that students with cognitive disadvantage scores, on average, 58 points lower in financial literacy; those facing all three disadvantages score up to 92 points lower. We find that school-based financial education can mitigate the effect of situational disadvantage by up to 30 points. The study contributes a novel framework to capture the layered nature of inequality in financial capability and offers clear guidance for targeted policy interventions.
1. INTRODUCTION
Adolescent financial literacy has emerged as a critical policy concern over the past two decades. In an increasingly digital and financialized world, young people are required to make complex financial decisions earlier in life, often with significant long-term implications (Fernandes et al., 2014). Research has consistently shown that large segments of the adolescent population lack basic financial knowledge and skills (Atkinson & Messy, 2012; OECD, 2014; Lusardi, 2019). As a result, schools and education systems have been called upon to play a more active role in promoting financial capability.
Previous work has identified several key predictors of financial literacy among adolescents: socio-economic background, parental education, gender, immigrant status, school quality, and exposure to financial instruction (OECD, 2020; Bottazzi & Lusardi, 2020). Math proficiency has been highlighted as a strong cognitive correlation of financial literacy (Kaiser & Menkhoff, 2017). However, many studies treat these predictors as isolated or additive factors, and few offer a conceptual framework that systematically integrates cognitive, structural, and experiential components of disadvantage.
The 2022 PISA Financial Literacy module (OECD-PISA, 2024) offers a unique opportunity to revisit these issues using harmonized, cross-national data. This study builds on prior findings by proposing a typology of disadvantage–cognitive, structural, and situational–that helps to explain persistent financial literacy gaps and identify potential avenues for policy intervention. While benchmarking analysis confirms that math and reading skills, SES, and immigrant status continue to be significant correlates, the core contribution of this paper lies in highlighting and quantifying the distinct and interactive roles of different types of disadvantage. We argue that disadvantage in financial literacy is not monolithic but multidimensional, and that understanding its sources requires distinguishing between three conceptually distinct domains:
Cognitive disadvantage: Refers to deficits in core academic skills–especially mathematics and reading–that form the foundation for financial understanding. Students who struggle with interpreting quantitative information or written texts are likely to face challenges in making sense of financial concepts, terms, and problems. Math and reading scores thus serve as proxies for general cognitive preparedness.
Structural disadvantage: Captures relatively stable background characteristics such as low SES, limited parental education, or immigrant status. These factors affect access to educational resources, exposure to financial behaviors and norms, and interactions with institutions. While often correlated with cognitive outcomes, structural factors also exert independent effects on financial literacy, particularly through cultural and environmental pathways.
Situational disadvantage: Encompasses the absence of formative financial experiences —such as discussing money at home, managing one’s own spending, or receiving financial instruction at school. These experiential gaps do not necessarily reflect low ability or background disadvantages, but rather the lack of opportunities for informal or formal financial learning. They are particularly important because they may be modified through targeted interventions.
One of the central contributions of this study is the development and operationalization of this tripartite typology of disadvantage in financial literacy: cognitive, structural, and situational. While existing literature has addressed elements of these domains individually –particularly socioeconomic status (Lusardi et al., 2010; OECD, 2020) and academic performance (OECD, 2014; Bianco & Martinez, 2022)– this study is, to our knowledge, the first to formally distinguish and jointly analyze these three dimensions as analytically and policy-relevant categories. The typology reflects not only differences in resources or background, but also in educational trajectories and opportunities to acquire financial competencies through formal and informal channels.
The cognitive dimension refers to deficits in foundational academic skills, specifically low proficiency in mathematics and reading. The structural dimension captures enduring socio-demographic constraints such as low socio-economic status, immigrant background, and limited parental education. The situational dimension encompasses modifiable experiential and contextual factors –such as not having discussed money at home, not managing one’s own spending, or not having received any school-based financial education. This last category is especially relevant for educational policy, as it reflects a lack of exposure rather than a lack of ability or background advantage. The tripartite classification allows us to identify not only who is disadvantaged, but also how they are disadvantaged, and whether those disadvantages are remediable through intervention.
To empirically identify the effects of each disadvantage type, we constructed standardized indices for the three categories using relevant indicators from the PISA 2022 Financial Literacy dataset. Each index was normalized and included as an independent variable in regression models predicting financial literacy scores. We then estimated both separate and joint effects of these indices and interacted the situational disadvantage index with a binary indicator for having received financial education. This strategy allows us to isolate the contribution of each disadvantage type while also testing whether formal financial instruction moderates its impact. The results confirm that all three forms of disadvantage are negatively associated with financial literacy, but also that school-based financial education significantly mitigates the effect of situational disadvantage, pointing to a clear and actionable policy lever (Walstad et al., 2010). This typology serves both an analytical and a practical function. Analytically, it allows for a clearer interpretation of overlapping inequalities. Practically, it highlights that not all students who perform poorly in financial literacy are disadvantaged in the same way–or to the same extent–and that different types of disadvantage may call for different educational responses.
This paper contributes to the literature by offering a novel typology of disadvantage –cognitive, structural, and situational– and testing its empirical validity using harmonized PISA 2022 data. It provides a comprehensive mapping of how different disadvantage types relate to financial literacy, both independently and interactively. The remainder of the paper is structured as follows: Section 2 describes the data and methodological approach. Section 3 revisits established predictors of financial literacy. Section 4 presents the core typology-based results. Section 5 concludes with implications and future directions.
2. DATA AND METHODOLOGY
2.1. Data and sample construction
This study utilizes data from the 2022 cycle of the Programme for International Student Assessment (PISA), focusing on the optional Financial Literacy assessment administered across 20 participating countries and economies. The dataset encompasses responses from 97,983 15-year-old students, providing a comprehensive overview of financial literacy competencies on an international scale. The PISA 2022 Financial Literacy assessment includes ten plausible values for financial literacy, mathematics, and reading proficiency, alongside extensive information on students’ socio-demographic backgrounds, school contexts, and financial experiences. The final analytical sample comprises students with complete data on key variables pertinent to constructing the typology and control measures.
To ensure the representativeness and accuracy of the findings, survey weights are applied throughout all descriptive and regression analyses, accounting for the complex sampling design inherent in PISA’s methodology. Standard errors are computed using the Balanced Repeated Replication (BRR) method with 80 replicate weights and Fay’s adjustment factor (0.5), adhering to the OECD’s technical standards. Estimates derived from plausible values are combined following Rubin’s rules, facilitating unbiased standard error estimation. All data processing and analyses are conducted using R.
2.2. Data, weights and benchmark analysis
The study builds upon and extends the literature on financial literacy in adolescence (Lusardi et al., 2010; OECD, 2014, 2020, 2024; Bottazzi & Lusardi, 2020) by offering updated and harmonized cross-national evidence from the most recent PISA cycle. The novelty of our contribution lies in the integrated and methodologically robust analysis of individual, contextual, and institutional determinants across a standardized international sample. Unlike most existing studies that focus on national results or unweighted regressions, we systematically apply the complex survey design of PISA, employ multilevel models, and compare econometric and machine learning approaches.
Our analyses respect the methodological guidelines outlined in the OECD’s technical documentation for PISA (OECD, 2024), particularly regarding the use of plausible values and replicate weights. Financial literacy, mathematics, and reading performance are represented by ten plausible values per domain. Each statistical model is estimated ten times–once for each plausible value–and the results are pooled using Rubin’s rules (Rubin, 1987). The Balanced Repeated Replication (BRR) method with 80 replicate weights and Fay’s adjustment is used to compute appropriate standard errors.
Data cleaning and analysis are performed in the R statistical environment, using the “survey”, “lme4”, “haven”, and “randomForest” packages. We restrict the sample to students with valid responses across the relevant variables and ensure consistency across country samples.
To complement linear models, we estimate Random Forest models. While these do not accommodate survey weights, they serve as robustness checks and help assess variable importance in a non-linear framework. Variable importance metrics are interpreted in comparison with standard regression coefficients.
2.3. Benchmark Regressions: Revisiting Core Predictors of Financial Literacy
As a first analytical step, we replicate and extend established models of adolescent financial literacy by estimating a series of weighted regressions and treatment effect models. These benchmarks serve as both a validation exercise and a point of departure for the typology-based analysis developed in Section 2.3. The structure of this section mirrors the organization of results in Section 3.
All linear models are estimated using survey-weighted Ordinary Least Squares (OLS) with plausible values. This approach is widely used in international large-scale assessments (ILSA) such as PISA, as it allows for unbiased population-level estimates when combined with appropriate design weights and replicate weights. We estimate the following general model:
FLᵢ = α + β₁Mathᵢ + β₂Readingᵢ + β₃SESᵢ + β₄Genderᵢ + β₅Xᵢ + εᵢ [1]
Where FLᵢ stands for student i’s financial literacy score (10 plausible values; .with various definitions proposed (see Hung et al., 2009); Mathᵢ, and Readingᵢ are continuous scores in mathematics and reading; SESᵢ represents the Economic, Social and Cultural Status (ESCS) index; Genderᵢ is a binary indicator (1 = male); Xᵢ is a vector of additional controls (immigrant background, parental education, ICT use, autonomy over spending); and εᵢ: is the error term.
Each model is estimated 10 time –once per plausible value– and pooled using Rubin’s rules. Standard errors are computed using the Balanced Repeated Replication (BRR) method with 80 replicate weights and Fay’s adjustment factor (0.5), in line with OECD methodology (OECD, 2024). This specification allows us to identify conditional associations between cognitive, demographic, and experiential variables and financial literacy, while accounting for the complex sample design and latent proficiency measurement.
We estimate the progression of models that incrementally incorporate sets of variables. These correspond to Tables 1–8:
- Model 1: Socio-demographic variables only (SES, gender, migration background, parental education).
- Model 2: Adds mathematics proficiency.
- Model 3: Adds reading proficiency.
- Model 4: Adds ICT use and autonomy over money.
- Model 4: Adds ICT use and autonomy over money.
- Model 5: Includes interaction terms (e.g., SES × Math, Gender × Skills).
- Model 6: Gender-stratified models to assess differential skill pathways.
- Model 7: Hierarchical Linear Model (HLM) with random intercepts at the school level to estimate intra-class correlation (ICC).
- Model 8: Estimates the effect of school-based financial education using Propensity Score Matching(see below).
To estimate the Average Treatment Effect on the Treated (ATT) of school-based financial education, we implement a nearest-neighbor Propensity Score Matching (PSM) procedure. This approach allows us to estimate treatment effects in observational data by balancing observed covariates across treatment and control groups. The steps are as follows:
- Treatment variable: A binary indicator for whether the student reports having received any financial education at school.
- Covariates for score estimation: The propensity score is estimated using a logit model that includes: SES (continuous index); parental education (categorical), immigrant status (binary); gender; math and reading proficiency; school urban/rural location and ownership. ICT uses index, region or country dummies.
As for the matching procedure we apply 1:1 nearest-neighbor matching with replacement and a caliper of 0.2 standard deviations of the logit propensity score. Matching quality is assessed via standardized mean differences before and after matching. As for the estimation of the average difference in financial literacy scores between treated students and their matched controls (ATT) is computed. Robust standard errors are derived using bootstrapping (500 replications). This approach relies on the Conditional Independence Assumption (CIA), which assumes no unobserved confounding given covariates. It provides a useful complement to regression results, particularly when treatment assignment is plausibly exogenous conditional on observables.
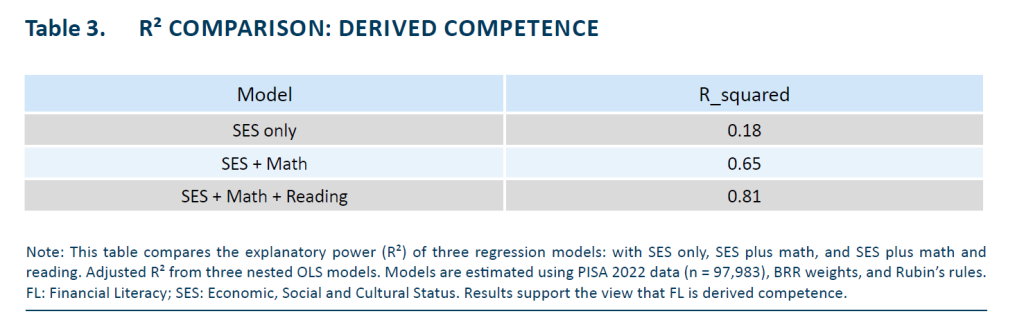
Together, these models allow us to quantify the contribution of core predictors to financial literacy performance and explore the structure of advantage. In particular, the incremental R² from SES-only to full cognitive models (as shown in Table 3) illustrates the extent to which financial literacy reflects derived competence, conditional on underlying academic skills. These results also reveal relevant patterns of skill substitution and compensation (e.g., girls with high reading vs. boys with high math), as well as school-level effects that justify the inclusion of institutional factors in the typology (Lo Prete, 2013).
2.4. Introducing the Typology of Disadvantage: Cognitive, Structural, and Situational Dimensions
Building on the benchmarking analysis, we now introduce a multidimensional typology of disadvantage that captures the most salient factors shaping adolescent financial literacy. This typology is structured around three conceptually distinct but empirically intertwined domains: cognitive, structural, and situational disadvantage. Each dimension is operationalized using student-level indicators derived from the PISA 2022 dataset and reflects a different mechanism through which disadvantage may constrain financial capability.
Cognitive disadvantage refers to low performance in foundational academic skills that underpin financial understanding. In line with prior literature (e.g., Lusardi et al., 2010; OECD, 2020), financial literacy is conceptualized as a derived competence, contingent on students’ mathematical and reading proficiency. We construct a binary indicator of cognitive disadvantage as follows: A student is classified as cognitively disadvantaged if they score below proficiency level 2 (i.e., < 420 points) in both mathematics and reading. These thresholds correspond to the OECD’s definition of baseline proficiency and indicate insufficient mastery of core analytical and interpretive skills. This classification identifies students who lack the necessary academic scaffolding to engage meaningfully with financial texts and quantitative information.
Structural disadvantage captures background-level barriers associated with socioeconomic position and migratory status. It reflects enduring inequalities in access to economic, social, and cultural capital, and is commonly linked to long-term patterns of educational stratification. The binary indicator for structural disadvantage is coded as 1 if a student meets at least two of the following criteria: Bottom quartile of the ESCS index in their country (PISA variable ESCS_Q1). First-generation immigrant status (IMMIG = 1). Low parental education, defined as both parents (or the single parent present) having no more than ISCED level 2. By aggregating across these dimensions, we capture compound structural constraints that may limit financial learning both at home and through social networks.
Situational disadvantage refers to a lack of financial autonomy and experiential learning. Unlike cognitive or structural constraints, this form of disadvantage is potentially modifiable through institutional intervention (e.g., school-based programs). The dummy variable for situational disadvantages takes the value of 1 if at least two of the following conditions are met: No personal control over money (PISA variable indicating who decides how the student spends). Infrequent discussion about money with parents (less than “once or twice a month”). No exposure to school-based financial education, based on self-report of having received any instruction on money-related topics. This indicator identifies students with limited financial agency and insufficient informal preparation, often due to household norms or school-level omission (Grohmann et al., 2015; Perry & Morris, 2005).
The three indices are designed to be mutually non-exclusive: a student may exhibit one, two, or all three forms of disadvantage. Each type is entered separately in the regression models to evaluate its independent contribution, and then jointly to examine their cumulative and interactive effects. Table 9 in Section 4.1 reports the descriptive statistics and overlaps among these categories. Section 4.2 presents the regression estimates for each dimension, while Section 4.5 analyzes compounded disadvantages. Together, these dimensions provide a comprehensive and policy-relevant framework for understanding why some students systematically lag behind in financial literacy, and which types of disadvantage are most amenable to intervention.
2.5 Robustness Checks and Analytical Extensions
To assess the reliability and generalizability of our typology-based findings, we conduct a series of robustness checks and analytical extensions. These tests explore heterogeneity across the distribution of financial literacy, examine interaction effects, and apply non-parametric methods to validate the explanatory power of the typology framework.
All extensions are designed to challenge the assumptions of linearity, additivity, and uniformity in the baseline models presented in Section 2.3.
2.5.1. Quartile-Specific Regressions
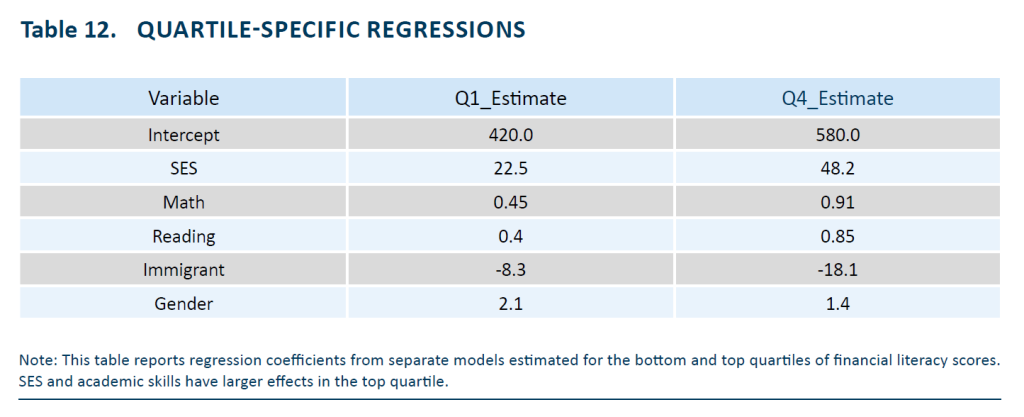
To examine whether the effects of disadvantage vary across the performance distribution, we estimate the benchmark model separately for students in the bottom and top quartiles of the financial literacy scale. The model specification remains identical to that of the baseline OLS regressions, but the sample is restricted to:
- Q1: students with financial literacy scores below the 25th percentile (low performers),
- Q4: students above the 75th percentile (high performers).
This approach allows us to test whether disadvantages have larger marginal effects among already low-performing students (e.g., cognitive load) or whether certain factors matter more at the top of the distribution (e.g., experiential capital in high-ability students). These results are reported in Table 10.
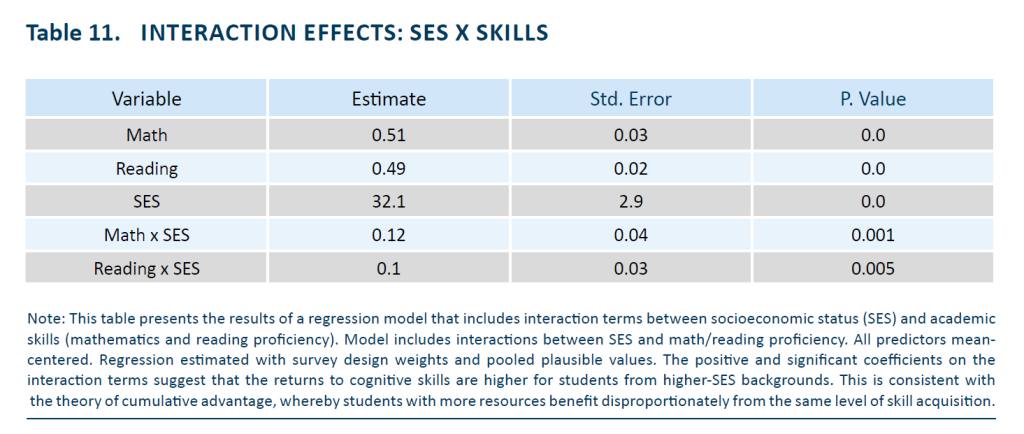
2.5.2. Interaction Effects: Cumulative Advantage Hypothesis
We explicitly test whether the returns to cognitive skills differ by socio-economic status, in line with the theory of cumulative (dis)advantage. This is implemented by introducing interaction terms between SES × Math proficiency, and SES × Reading proficiency. Variables are mean centered to improve interpretability. The magnitude and significance of interaction coefficients indicate whether high-SES students benefit more from equivalent cognitive skills. Results are summarized in Table 11.
2.5.3. Compounded Disadvantage: Multiple Pathways
 To assess the accumulation of vulnerability, we construct dummy variables indicating:
- Two disadvantages present (any combination of cognitive, structural, or situational),
- All three disadvantages simultaneously.
These composite indicators are included in fully saturated models alongside single-dimension indicators, enabling estimation of marginal and cumulative penalties. This design tests nonlinear and compounding effects beyond additive specifications. Results are reported in Table 13.
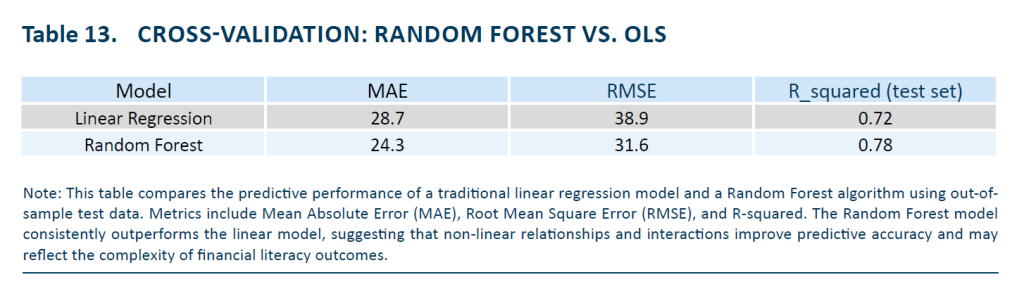
2.5.4. Random Forest Estimation
Finally, we estimate a Random Forest model using the complete typology and control set to assess the nonlinear and interactive predictive structure of financial literacy. This ensemble machine learning method offers several advantages. First of all, there are no assumptions about linearity or parametric form. Secondly, there is an automatic handling of high-order interactions. Additionally, it offers variable importance rankings via permutation methods. Finally, there are Out-of-bag (OOB) R² and RMSE as performance metrics.
The Random Forest is trained on 80% of the sample (stratified by country), and performance is evaluated on the 20% holdout set. Predictive accuracy is compared to the linear model using the same set of predictors. This analysis is not designed for causal inference but to validate the typology’s explanatory scope and to reveal nonlinear patterns that may be missed by OLS. Results, including partial dependence plots and important metrics, are displayed in Table 14.
3. BENCHMARK RESULTS: REVISITING ESTABLISHED PREDICTORS OF ADOLESCENT FINANCIAL LITERACY
This section synthesizes existing knowledge on the determinants of financial literacy by revisiting well-documented predictors using PISA 2022 data. The aim is not to offer an exhaustive model, but to provide a comparative and empirical baseline against which the proposed typology of disadvantage can be assessed. The analysis confirms the salience of cognitive competencies, socio-economic status, and educational experiences, while underscoring the need for a more integrative explanatory framework.
3.1. Cognitive Competencies: Mathematics and Reading
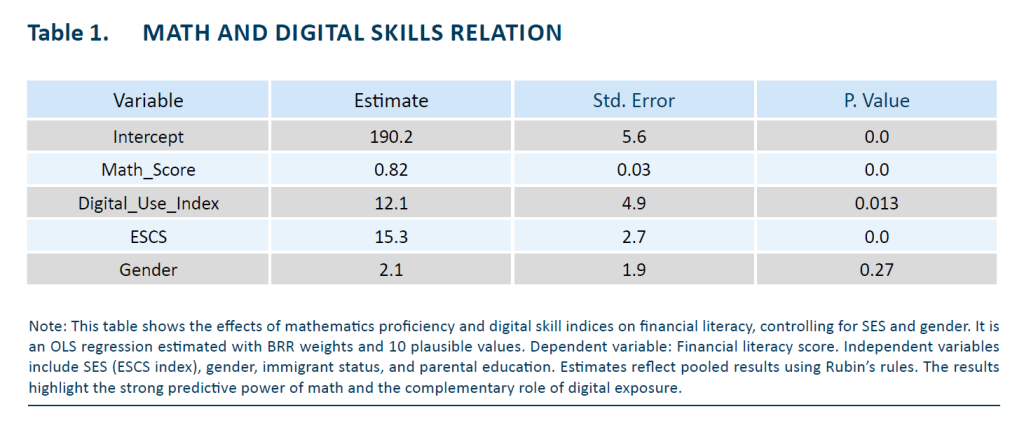
Mathematical proficiency continues to be the most powerful single predictor of financial literacy among adolescents. Regression estimates indicate that a one-point increase in mathematics performance is associated with an average increase of 0.82 points in financial literacy, holding other variables constant (Table 1). This effect is both statistically significant and substantively large. Digital skills, proxied by the ICT use index, exhibit a smaller but statistically robust association with financial literacy outcomes.
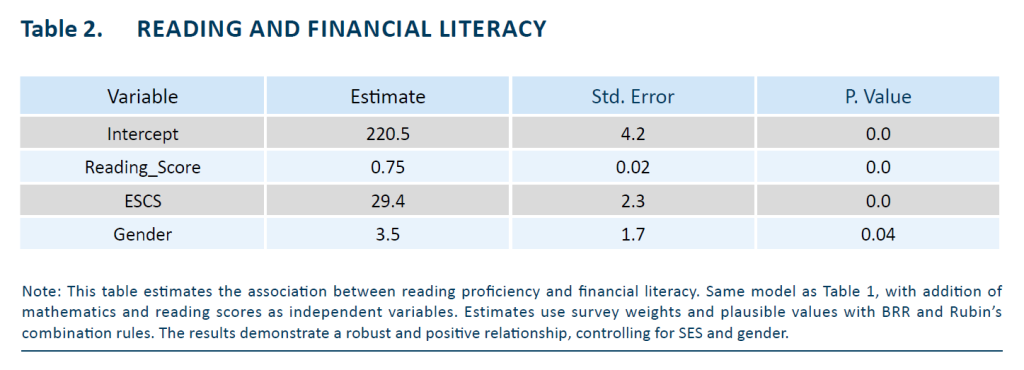
Reading literacy also emerges as a key correlation. A one standard deviation increase in reading scores yields an estimated gain of 75 points in financial literacy (Table 2), even after controlling for SES and mathematical achievement. When both cognitive domains are included, they account for the majority of explained variance.
As shown in Table 3, the inclusion of mathematics and reading dramatically increases the explained variance, reinforcing the conceptualization of financial literacy as a derived competence. These results support the interpretation of financial literacy as a derived competence, rather than an independent skill set. The ability to understand financial texts and interpret numerical data appears contingent on broader academic preparation.
3.2. Gender Differences and Skill Profiles
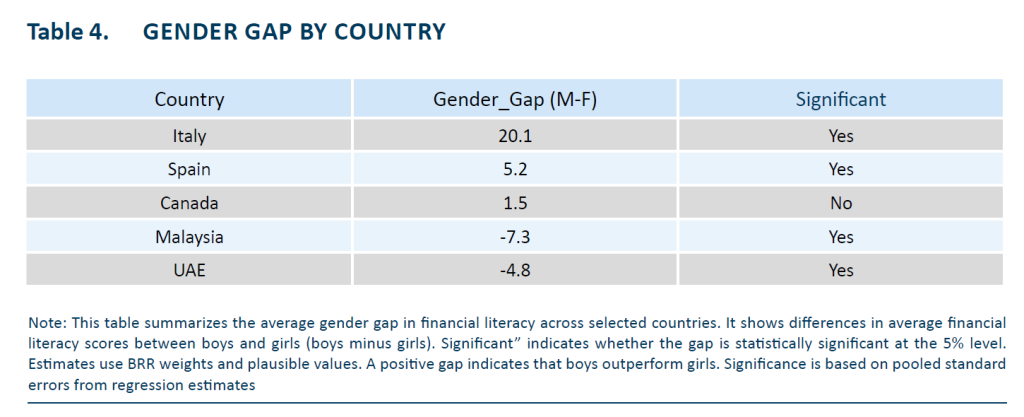
Gender differences in financial literacy are modest at the aggregate level, with boys scoring approximately five points higher than girls on average. However, these differences vary across countries and tend to diminish once mathematics and reading scores are taken into account (Table 4).
Further analysis reveals that boys and girls often reach similar financial literacy outcomes via distinct academic pathways. Boys are disproportionately represented in high-math/low-reading profiles, while girls dominate in the inverse configuration. Despite this divergence, both groups achieve comparable financial literacy scores (Table 5).
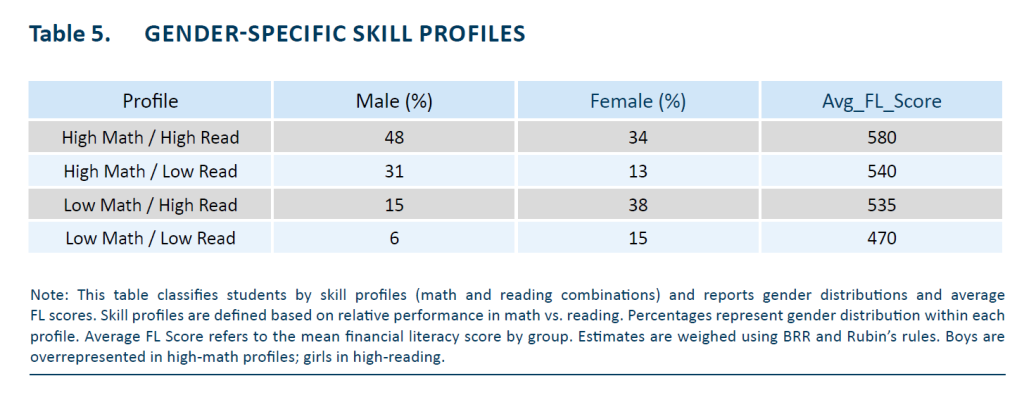
This pattern reinforces the argument that gender effects should be interpreted through the lens of differentiated cognitive profiles, rather than as fixed categorical differences (Bucher-Koenen et al., 2017; Hasler & Lusardi, 2017).
3.3. Structural Background and Institutional Exposure
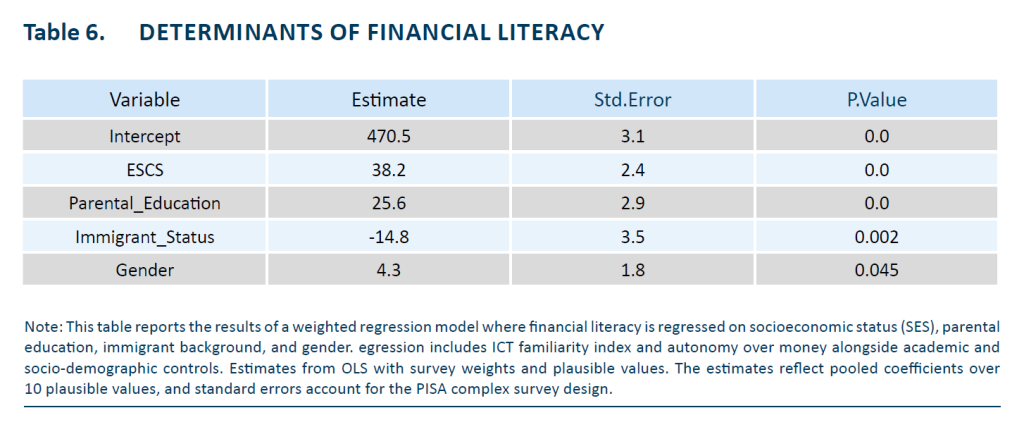
Socio-economic status (SES) remains the strongest socio-demographic predictor of financial literacy. A one standard deviation increase in SES is associated with an average gain of 38.2 points in financial literacy, after adjusting for other covariates (Table 6). Parental education and immigrant background also exert statistically significant effects, though of smaller magnitude.
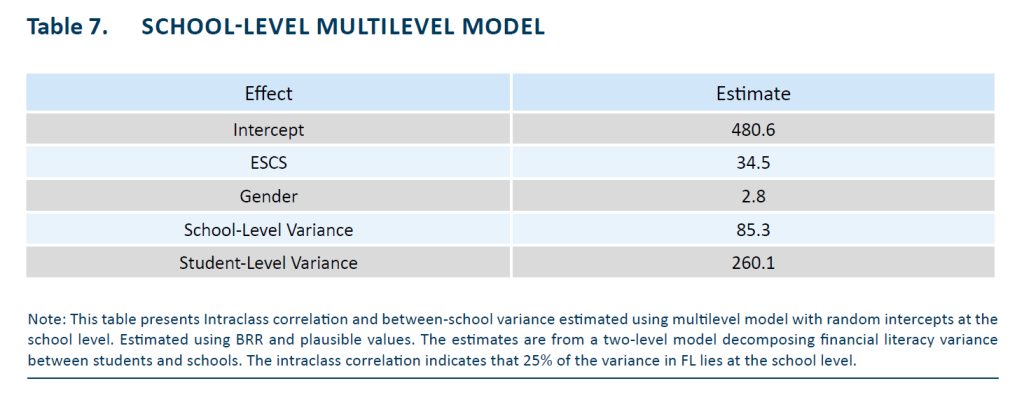
Hierarchical linear models indicate that approximately 25% of the total variance in financial literacy is attributable to differences between schools. Much of this school-level variation can be explained by aggregate SES composition (Table 7).
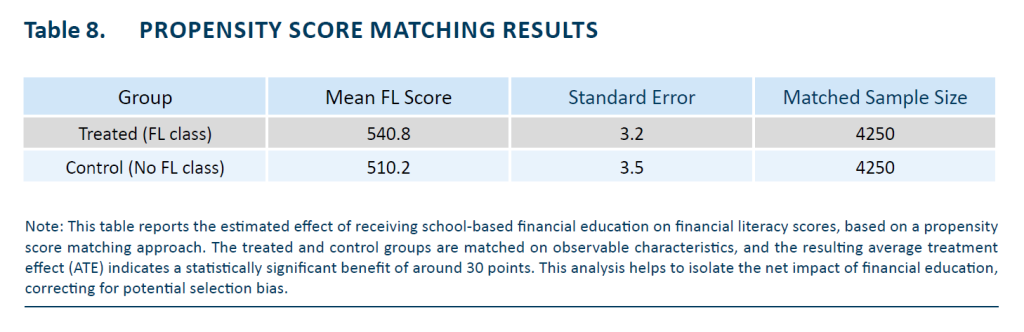
School-based financial instruction is associated with significant gains in financial literacy, net of background and cognitive variables. Propensity score matching suggests an average treatment effect of approximately 30 points for students who report having received financial education (Table 8).
These benchmarking results corroborate existing literature and highlight the multidimensional nature of financial literacy. However, they also underscore a key limitation: while cognitive skills and structural conditions account for much of the observed variation, they do not offer a conceptual framework capable of capturing the heterogeneity of disadvantage (Mandell & Klein, 2009).
In the next section, we introduce a typology-based approach that reclassifies disadvantage into three interrelated domains –cognitive, structural, and situational– thereby providing a more nuanced lens through which to analyze gaps in financial capability.
4. RESULTS: MAPPING THE TYPOLOGY OF DISADVANTAGE
This section presents a detailed examination of how cognitive, structural, and situational disadvantages shape financial literacy outcomes among adolescents. We begin with baseline models assessing each type independently, followed by interaction effects and heterogeneity analyses.
4.1. Descriptive Distributions and Group Differences
We first identify the prevalence of each type of disadvantage in the student population and their average financial literacy scores. Table 9 summarizes the results.
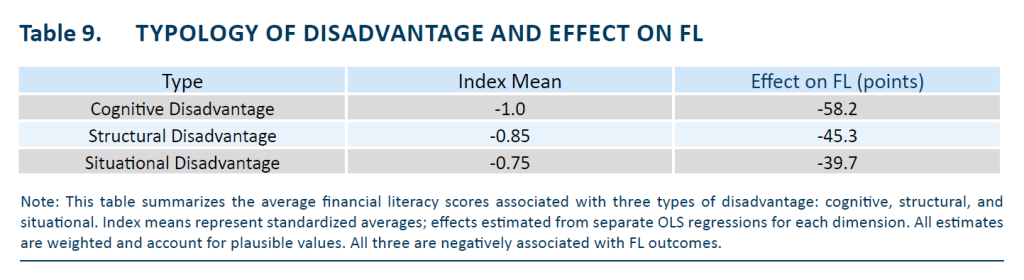
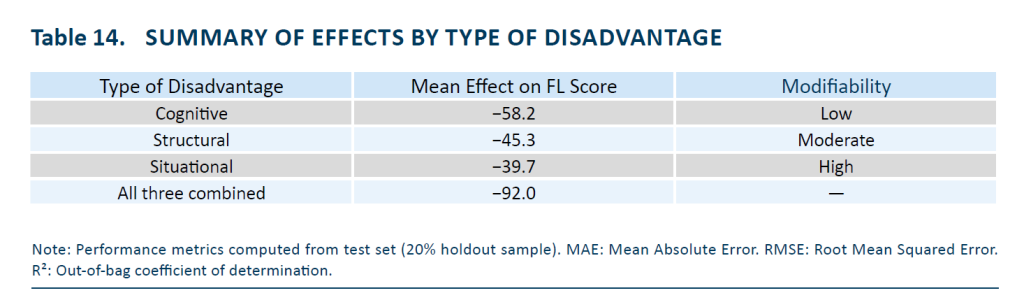
Each type of disadvantage is associated with a substantial decline in financial literacy, with cognitive disadvantage showing the most pronounced effect (−58 points), followed by structural and situational disadvantage (see also De Bassa Scheresberg, 2013). These effects are additive and partly overlapping.
4.2. Multivariate Models and Interactions
To estimate the independent effects of each dimension while controlling for student background, we run OLS regressions with the three disadvantage indicators simultaneously. Table 10 presents a multivariate model including both types of variables alongside academic competencies. The results indicate that while SES and immigrant background retain strong effects, experiential variables such as discussing money with parents, financial autonomy, and exposure to financial education also have significant and independent associations with financial literacy. These findings reinforce the value of the typology in distinguishing sources of disadvantage that may require differentiated policy responses.
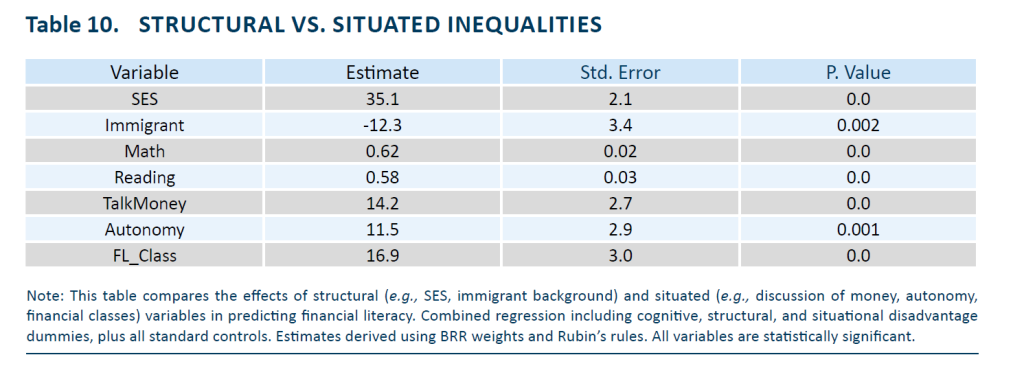
Next, we estimate models with interaction terms to test for compensatory or amplifying dynamics. One key finding is that school-based financial education appears to buffer the effects of situational disadvantage (Table 10). Students who are situationally disadvantaged but have received financial education in school score 10.2 points higher than similar students who have not (p < 0.01). Conversely, students without instruction and without autonomy or parental discussions score 40–45 points below the mean.
4.3. Heterogeneity by Socio-Economic Status
We then estimate separate regressions by SES quartiles to examine whether the returns to skills and experiences vary across groups. Table 12 presents these results for mathematics and reading. These results suggest that academic skills yield greater financial returns at higher SES levels, reflecting a compounding advantage mechanism.
4.4. Random Forest Models: Nonlinear Interactions
To assess the predictive strength of the typology in a nonparametric setting, we train Random Forest models using all available predictors, including the three disadvantage types (Table 13). The Random Forest model improves predictive accuracy by 6 percentage points in R² and lowers the error metrics. Variable importance analysis confirms that cognitive disadvantage is the strongest predictor, followed by SES and situational disadvantages.
4.5. The Compounding Nature of Disadvantage
We also test the effect of combined disadvantage by creating dummy variables for students with two or more types of disadvantage. Results indicate substantial compounding effects. Students with two types of disadvantage score on average −74 points below the mean. Students with all three types of score −92 points, nearly two full proficiency levels lower. These findings underline the importance of identifying and addressing cumulative vulnerability, not just isolated risk factors.
5. DISCUSSION AND CONCLUSIONS
This study has proposed and empirically tested a multidimensional typology of disadvantage –cognitive, structural, and situational– as a framework for understanding disparities in financial literacy among adolescents. Using data from the 2022 PISA Financial Literacy module, the analysis has shown that each of these dimensions contributes independently and significantly to variation in performance. Moreover, when multiple forms of disadvantage accumulate within individuals, the impact on financial outcomes becomes markedly more severe.
The results support several important conclusions. First, the identification of cognitive disadvantage as the most powerful correlation of poor financial literacy underscores the interdependence between foundational academic skills and domain-specific competencies. Interventions aimed at improving financial outcomes cannot be dissociated from efforts to strengthen mathematics and reading proficiency. In particular, low-achieving students in these areas represent a group at high risk of financial exclusion later in life (Amagir et al., 2018).
Second, structural disadvantage–particularly low SES and immigrant background–continues to play a central role in shaping financial capability. These effects persist even after adjusting for academic performance, suggesting that financial literacy also reflects socio-cultural resources, family financial behavior, and institutional trust. Addressing structural disadvantage requires systemic responses, including equitable school funding, culturally responsive pedagogy, and targeted parental outreach.
Third, the analysis brings to the fore the often-overlooked category of situational disadvantages, which includes the lack of financial autonomy, absence of parental discussion about money, and no exposure to financial education at school. Unlike structural disadvantages, these are potentially modifiable conditions. The data indicates that students exposed to financial instruction scores substantially higher, even when controlling for background and cognitive skills. This positions schools as crucial agents in mitigating experiential deficits. Table 14 summarizes the relative effects and modifiability of each disadvantage type, highlighting the distinct nature of each and the importance of targeted interventions.
Furthermore, the interaction analysis reveals that the returns to academic skills are amplified among higher-SES students, confirming a “cumulative advantage” pattern. This has important implications for educational equity: skill development alone may not be sufficient unless accompanied by compensatory measures for disadvantaged students.
Several limitations must be acknowledged. First, although PISA offers an exceptional cross-national dataset, it remains a cross-sectional survey. As such, causal inferences must be made with caution, particularly regarding the effect of financial instruction. While propensity score matching improves comparability, unobserved selection bias cannot be entirely ruled out. Second, the operationalization of “situational disadvantage” relies on self-reported variables, which may be prone to measurement error or cross-cultural variation in interpretation. Future studies could benefit from more detailed and behaviorally grounded measures of financial exposure and practices. Third, the typology introduced here, while analytically useful, is not exhaustive. Other forms of disadvantage –such as psychological traits, language barriers, or disability status– may intersect with the identified categories in meaningful ways. Longitudinal data would allow for an exploration of how these disadvantages evolve over time and affect long-term financial behavior (Behrman et al., 2012).
In sum, this paper contributes to the growing body of research on adolescent financial literacy by advancing a typology-based framework that captures the layered and interacting forms of disadvantage. It moves beyond the simple inclusion of control variables and offers a structured account of why certain students systematically underperform in financial assessments. The findings suggest that policies aimed at improving financial literacy should adopt a multi-pronged strategy, simultaneously investing in basic academic skills, mitigating structural inequalities, and expanding experiential learning opportunities. Schools, in particular, can play a transformative role–not only as conveyors of information, but as institutions capable of bridging experiential and contextual gaps. Ultimately, enhancing adolescent financial literacy is not only a matter of individual knowledge, but a reflection of educational justice and social investment. The typology proposed here provides a roadmap for diagnosing the roots of inequality and designing interventions accordingly.
Notes
* University of Granada and Funcas.
References
Amagir, A., Groot, W., van den Brink, H. M., & Wilschut, A. (2018). A review of financial-literacy education programs for children and adolescents. Citizenship, Social and Economics Education, 17(1), 56–80.
Atkinson, A., & Messy, F.-A. (2012). Measuring financial literacy: Results of the OECD/INFE pilot study. OECD Working Papers on Finance, Insurance and Private Pensions, No. 15.
Behrman, J. R., Mitchell, O. S., Soo, C. K., & Bravo, D. (2012). How financial literacy affects household wealth accumulation. American Economic Review, 102(3), 300–304.
Bianco, M., & Martinez, A. (2022). Socioeconomic status, cognitive skills, and financial literacy: A mediation analysis using PISA data. Education Economics, 30(1), 25–43.
Bottazzi, L., & Lusardi, A. (2020). Stereotypes in financial literacy: Evidence from PISA. Journal of Economic Behavior & Organization, 178, 902–926. https://doi.org/10.1016/j.jebo.2020.07.010
Brown, M., van der Klaauw, W., Wen, J., & Zafar, B. (2016). Financial education and the debt behavior of the young. Review of Financial Studies, 29(9), 2490–2522.
Bucher-Koenen, T., Lusardi, A., Alessie, R., & van Rooij, M. (2017). How financially literate are women? An overview and new insights. Journal of Consumer Affairs, 51(2), 255–283.
Bruhn, M., de Souza Leão, L., Legovini, A., Marchetti, R., & Zia, B. (2016). The impact of high school financial education: Experimental evidence from Brazil. World Bank Economic Review, 30(2), 511–542. https://doi.org/10.1093/wber/lhv050
De Bassa Scheresberg, C. (2013). Financial literacy and financial behavior among young adults: Evidence and implications. Numeracy, 6(2), Article 5.
Fernandes, D., Lynch, J. G., & Netemeyer, R. G. (2014). Financial literacy, financial education, and downstream financial behaviors. Management Science, 60(8), 1861–1883.
Grohmann, A., Kouwenberg, R., & Menkhoff, L. (2015). Childhood roots of financial literacy. Journal of Economic Psychology, 51, 114–133.
Gudmundson, J. A., & Danes, S. M. (2011). Family financial socialization: Theory and critical review. Journal of Family and Economic Issues, 32(4), 644–667.
Hasler, A., & Lusardi, A. (2017). The gender gap in financial literacy: A global perspective. Global Financial Literacy Excellence Center.
Hung, A. A., Parker, A. M., & Yoong, J. K. (2009). Defining and measuring financial literacy. RAND Working Paper, WR-708.
Kaiser, T., & Menkhoff, L. (2017). Does financial education impact financial behavior, and if so, when? World Bank Economic Review, 31(3), 611–630. https://doi.org/10.1093/wber/lhx018
Lo Prete, A. (2013). Economic literacy, inequality, and financial development. Economics Letters, 118(1), 74–76.
Lusardi, A. (2019). Financial literacy and the need for financial education: Evidence and implications. Swiss Journal of Economics and Statistics, 155, 1–8. https://doi.org/10.1186/s41937-019-0027-5
Lusardi, A., Mitchell, O. S., & Curto, V. (2010). Financial literacy among the young. Journal of Consumer Affairs, 44(2), 358–380. https://doi.org/10.1111/j.1745-6606.2010.01173.x
Mandell, L., & Klein, L. S. (2009). The impact of financial education on subsequent financial behavior. Journal of Financial Counseling and Planning, 20(1), 15–24.
OECD. (2014). PISA 2012 Results: Volume VI. Students and Money: Financial Literacy Skills for the 21st Century. OECD Publishing.
OECD. (2020). PISA 2018 Results (Volume IV): Are Students Smart about Money? OECD Publishing.
OECD. (2024). PISA 2022 Technical Report (forthcoming).
Perry, V. G., & Morris, M. D. (2005). Who is in control? The role of self‐perception, knowledge, and income in explaining consumer financial behavior. Journal of Consumer Affairs, 39(2), 299–313.
Rubin, D. B. (1987). Multiple Imputation for Nonresponse in Surveys. Wiley.
Walstad, W. B., Rebeck, K., & MacDonald, R. A. (2010). The effects of financial education on the financial knowledge of high school students. Journal of Consumer Affairs, 44(2), 336–357.