

Understanding the Dispersion of Environmental Scores across Industrial Sectors*
Environmental scores, rating discrepancies, sustainability metrics, data providers
Juan Ignacio Peña**, Kurt A. Desender*** and Bing Guo****
Papeles de Energía, N.º 31 (febrero 2026)
This paper aims to explore factors that may explain the dispersion of environmental ratings across industrial sectors. The paper studies external dispersion –the discrepancy in E ratings across raters–, and internal dispersion –the discrepancy across E dimensions within a single rater. We classify industrial sectors by their degree of “greenness” or “brownness” based on their unscaled greenhouse gas (GHG) emissions. We study the impact of characteristics such as the ownership structure (including common ownership, institutional ownership, or family ownership), the proportion of independent directors on the board, the degree of CEO duality, and board- and executive-level gender diversity on the dispersion of environmental ratings. External dispersion mainly reflects cross-rater comparability problems driven by firm complexity, ownership structure, and political context, whereas internal dispersion captures persistent within-rater heterogeneity across environmental dimensions. External dispersion primarily signals methodological divergence across providers, whereas internal dispersion reflects informative multidimensional environmental performance.
1. INTRODUCTION
The global financial environment has focused on Environmental, Social, and Governance (ESG) factors as key elements in company valuation for several years (Gibson et al., 2022). For example, over the past decade, ESG considerations have become deeply embedded in European financial markets, supported by regulatory initiatives such as the EU Taxonomy, the Sustainable Finance Disclosure Regulation (SFDR), and the Corporate Sustainability Reporting Directive (CSRD). Institutional investors increasingly incorporated ESG ratings into portfolio construction, rising from 12% in 2018 to 43% in 2022 (Wong et al., 2023), while policymakers promoted standardized sustainability disclosure as a cornerstone of capital market integration. However, the policy momentum behind this conventional ESG framework is now being reassessed. Evidence of substantial divergence across ESG rating providers has raised concerns among regulators, supervisors, and market participants about comparability, transparency, and the risk of misallocation of capital. Studies documenting ESG rating variability, including the present analysis, have contributed to a shift in the debate: from expanding the use of ESG ratings to scrutinizing their methodological foundations and considering stronger harmonization and oversight mechanisms.
Kotsantonis and Serafeim (2019) indicate that the most significant obstacle to using ESG data in investment decisions is the lack of comparability of ESG metrics across companies and over time. Avramov et al. (2022) show that demand for equities decreases and market risk increases if there is uncertainty in ESG ratings. Billio et al. (2021) find that disagreement among rating scores disperses the effect of ESG preferences on asset prices to the point that ratings no longer affect financial performance. Berg et al. (2022) introduce the concept of “aggregate confusion,” referring to the divergence in ESG ratings stemming from differing methodologies and definitions across rating agencies. They document the rating divergence and decompose it into scope, measurement, and weight contributions.
The motivation for this paper stems from the results in Peña et al. (2025), which study the external (i.e., disagreement in environmental scores across rating agencies) and internal (i.e., disagreement across environmental dimensions within a single rating provider) dispersion of the E ratings. They document that large firms, firms with more tangible assets, firms with strong expected future performance, firms with credit ratings, and those in Democratic-leaning states experience higher rating discrepancies. In contrast, more profitable firms see lower disagreement, and the covariation between the growth opportunities and disagreement is significant. Moreover, although internal and external discrepancies are related to similar factors, the direction and nature of their association differ, highlighting the complexity of factors driving rating disagreements. However, they do not examine differences across industries in GHG emissions.
While prior research documents substantial disagreement across ESG rating providers and identifies firm-level determinants of rating dispersion, existing studies do not examine whether the drivers and interpretation of rating disagreement differ systematically across sectors with different environmental intensity. In particular, little is known about whether rating dispersion reflects measurement problems or economically meaningful heterogeneity in environmental performance conditional on sectoral emissions exposure. The novelty of this paper lies in classifying industries into two categories, “green” and “brown”, and examining whether the economic determinants and interpretation of environmental rating dispersion differ across these sectoral environments. The criteria for assigning industries to a category depend on an emissions-based indicator. Higher values of this indicator correspond to industries in which firms exhibit higher CO2-equivalent emissions. We investigate which firm characteristics are associated with the internal and external dispersion of E ratings across both categories, highlighting their differences and similarities.
Disagreement across rating agencies is more pronounced in brown (high-emission) industries, especially due to ownership structure and political factors. In greener industries, cross-agency differences are more influenced by profitability and institutional investors, suggesting that better disclosure helps reduce confusion. Within a single rating agency, however, green industries show more variation across environmental dimensions, reflecting real strengths and weaknesses. In brown industries, internal ratings tend to be more uniform, particularly in firms with strong family control or high credit quality. In short, brown sectors face more comparability problems across raters, while green sectors display more meaningful internal differences in environmental performance.
The main message of this paper is straightforward but important: not all disagreement in environmental ratings means the same thing. When different rating agencies give very different scores to the same company, the gap often comes from differences in methods, definitions, or weighting, but not necessarily from real differences in environmental performance. This type of disagreement can confuse investors and make it harder to compare companies. By contrast, when E ratings produced by a single agency show that a company performs well in some environmental areas but poorly in others, this may reflect real strengths and weaknesses rather than measurement problems.
This distinction matters for decision-makers. For policymakers, the priority should be improving transparency and consistency across rating providers to prevent avoidable methodological differences from distorting markets. For investors, the lesson is clear: a single headline ESG score is not enough. Therefore, understanding why ratings differ is essential for sound capital allocation. For managers, clearer and more structured disclosure can reduce cross-agency disagreement while still revealing the company’s environmental challenges. In short, disagreement in ESG ratings is not automatically a flaw. Nevertheless, knowing its source is crucial for better policy, better investment decisions, and better corporate strategy.
The rest of the paper is structured as follows: Section 2 discusses related literature, Section 3 details the database and the criteria for building the green and brown categories. Section 4 discusses the empirical results, and Section 5 concludes.
2. RELATED LITERATURE
Chatterji et al. (2016) show considerable disagreement among the ESG ratings of the top data providers. Huber and Comstock (2017) note that providers’ methodologies, scopes, and coverage of reports and ratings vary significantly. Christensen et al. (2021) present evidence that companies that provide more information about their ESG factors exhibit the most significant disagreement (or variation) in their ESG ratings. In addition, the greater the disagreement between ESG ratings, the higher the volatility of equity returns and the lower the likelihood of resorting to external financing. Therefore, this indicates that more
disclosure of ESG data increases disagreement in ESG ratings rather than decreases it. Notably, disagreement is greatest in the E and S categories, whereas agreement among raters is higher in the G category. One possible reason for these results is that more information increases the likelihood of different interpretations. This issue is important because, without agreement on what constitutes good ESG performance, it is doubtful that ESG ratings will provide relevant information for investment decisions.
In addition, the ESG rating agency industry raises controversial issues, such as potential conflicts of interest and greenwashing. Theory and evidence (Pedersen et al., 2021) suggest that the impacts on several firm value measures of separate E, S, and G or ESG may differ. For instance, G ratings correlate positively with equity value, S ratings correlate negatively, and E ratings present mixed results. This paper focuses on the E dimension for several reasons. First, the E-dimension is directly linked to observable factors such as carbon emissions and water use, enabling a more objective and measurable assessment of environmental performance than social or governance performance (Gibson et al., 2021). Second, the growing global emphasis on environmental sustainability, as reflected in international agreements such as the Paris Climate Agreement, has heightened the importance of E-related disclosures and performance metrics. Third, compared to the social dimension, which encompasses a broad and diverse set of factors, such as labor rights, diversity, and community impact, E is a more narrowly defined measure, facilitating better comparability across firms.
3. DATA
In this section, we describe the data sources and the methodology for assigning industries to the “green” and “brown” categories.
3.1. Data Sources
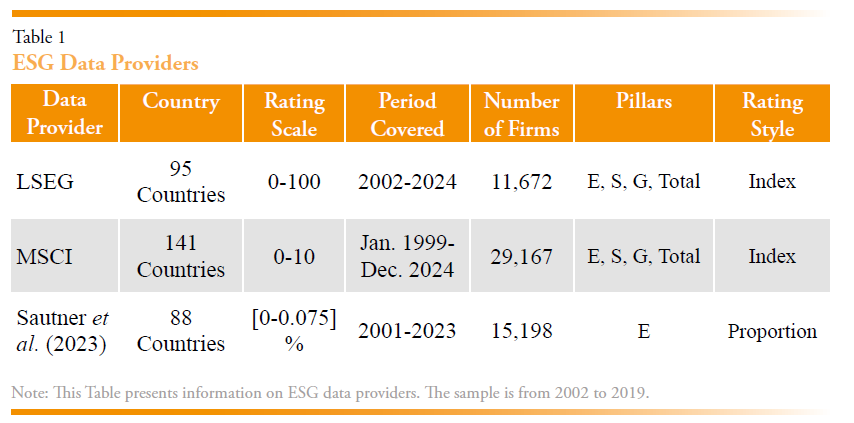
This paper uses a sample of environmental performance data from three databases covering 2002 to 2019 for US-listed companies to extract environmental performance measures. As a novelty relative to the extant literature, the sample includes a database constructed by Sautner et al. (2023) that focuses explicitly on the environmental dimension and two commercial providers, LSEG Data & Analytics (previously known as Refinitiv or Asset4) and MSCI ESG Research, whose data have been widely used in many academic studies. We consider all firms for which data is available for all three ratings from 2002 to 2019. The initial sample includes 15,553 firm-year observations from 3,244 firms. Our first data source provides a commercial ESG rating by LSEG Data & Analytics, a financial data company owned by the London Stock Exchange Group (LSEG). Its environmental performance scores assess firms on various sustainability criteria, including resource use, environmental innovation, and climate-related disclosures. Our second source is another commercial ESG rating provided by the MSCI ESG Research database, initially developed by KLD Research & Analytics, Inc., and later acquired by MSCI (Morgan Stanley Capital International). This rating provider focuses on several ESG dimensions, strengths, and concerns. This database is a long-established, detailed repository of ESG indicators, particularly in the U.S. market. Our focus is on environmental strengths and concerns, including corporate environmental practices such as pollution, renewable energy use, and compliance with environmental regulations. Our third non-commercial data source is the climate change exposure constructed by Sautner et al. (2023). To construct this measure, Sautner et al. (2023) focus on corporate quarterly earnings calls to assess firms’ climate change risks and opportunities. They capture a firm’s exposure to a topic by measuring the proportion of the conversation during earnings calls dedicated to that subject (Hassan et al., 2019). Compared to the commercial environmental ratings, this measure provides an alternative perspective by focusing on the attention financial analysts and management devote to climate change topics during conference calls. The external dispersion is computed as the standard deviation of the standardized individual ratings. Table 1 provides further information about ESG data providers, the firms and periods they cover, and the number of firms and rating scales.
We then incorporate firms’ financial and accounting data (e.g., total assets, leverage, capital expenditures, or cash holdings) from Compustat North America to the initial sample. Data on stock price volatility come from CRSP. We also retrieve data on board characteristics, institutional investors’ ownership structures, and Moody’s credit ratings from LSEG. The final sample includes 9,046 firm-year observations, which correspond to 1,472 firms.
3.2. Green and Brown Industries
Refinitiv provides three variables related to CO2 emissions: co2emistorevscore, co2equivalentemissions, and co2eqemitoevic. The co2emistorevscore is the relative score Refinitiv assigns to this category; co2equivalentemissions is the measure of total CO2-equivalent emissions, defined as the sum of a company’s direct and indirect greenhouse gas emissions, measured in tons; and CO2eqemitoevic measures CO2 and equivalent emissions to Enterprise Value Including Cash (EVIC). There are 133 industry codes with CO2 emissions data.
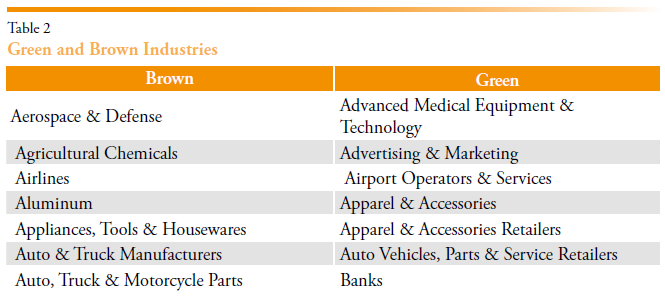
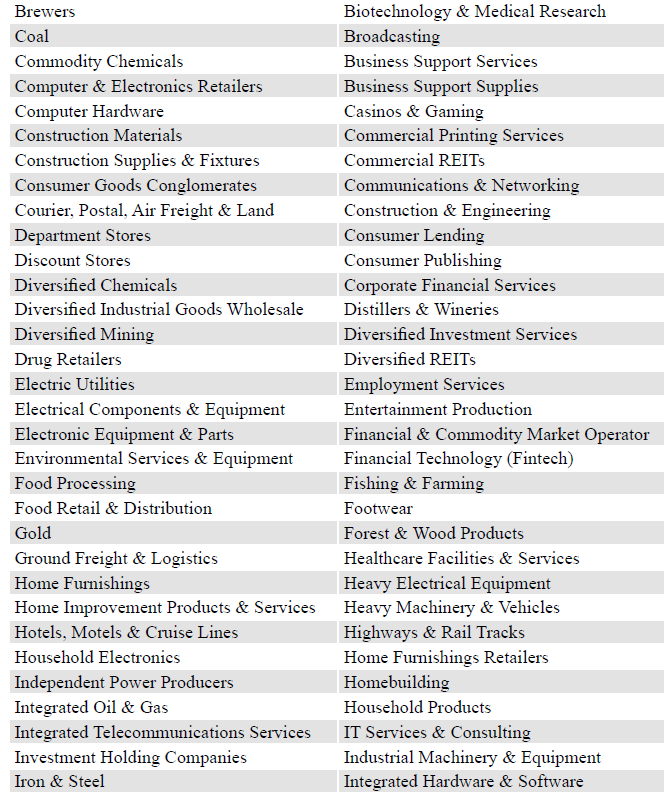
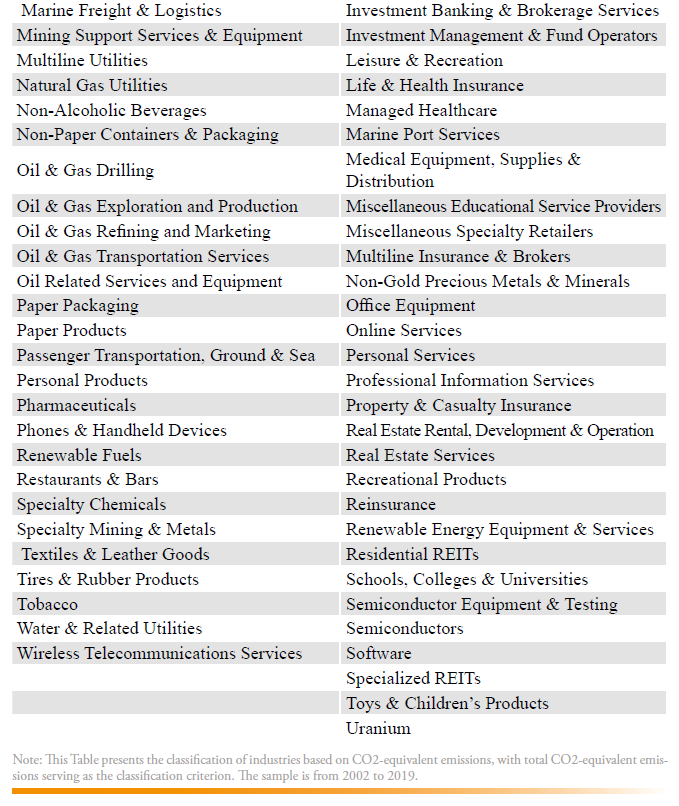
In this paper, we focus on the variable co2equivalentemissions because the objective is to classify industries based on their contribution to aggregate environmental pressure rather than their emissions efficiency relative to firm size. We calculate the median CO2-equivalent emissions for each industry code using firm-year observations. We define a firm-year observation as having high CO2-equivalent emissions if its measure is above the median across all firm-year observations in its industry, and low otherwise. The variable High_co2equivalentemissions is equal to 1, and Low_co2equivalentemissions is equal to 0. Next, we compute a score as follows. For instance, if in one industry there are six (firm-year) observations, three are high_co2equivalentemissions, two are low_co2equivalentemissions, and one has no information, then the score for this industry would be (1+1+1+0+0)/5=0.6 across all six observations. The higher the score, the more firms in that industry have high CO2-equivalent emissions. In other words, the score captures the prevalence of high-emission firm-years relative to that industry’s own distribution. After calculating the score for each industry code, we take the median across all industry scores. One industry is defined as green (brown) if its score is lower (higher) than or equal to the median. Therefore, an industry is deemed green (brown) when it shows a lower (higher) prevalence of high-emission firm-years relative to its within-industry distribution. The indicator variable for green industries using this method is greenind_co2eqvem. The classification of green and brown industries using this indicator is in Table 2.
It is important to note that this classification is based on the prevalence of high emitters within each industry’s distribution, not on absolute emissions. Therefore, the classification captures within-industry prevalence of high emitters, not absolute emission levels across industries.
4. RESULTS
This section presents empirical results. We emphasize that both external and internal dispersion of environmental ratings may reflect either informational content or noise, depending on context. The regressions that follow, therefore, document systematic associations rather than causal interpretations of rating disagreement. Ownership structure, governance features, profitability, and disclosure quality are likely jointly determined, and rating disagreement may both influence and respond to firms’ reporting practices. For example, institutional investors may select firms with more standardized reporting practices, while firms experiencing greater rating disagreement may adjust disclosure policies or governance structures in response. Similarly, profitability may proxy for investments in internal reporting systems rather than directly influencing rating dispersion. Accordingly, the estimates capture equilibrium correlations in cross-rater disagreement rather than structural effects of firm characteristics on rating dispersion.
4.1. External Dispersion
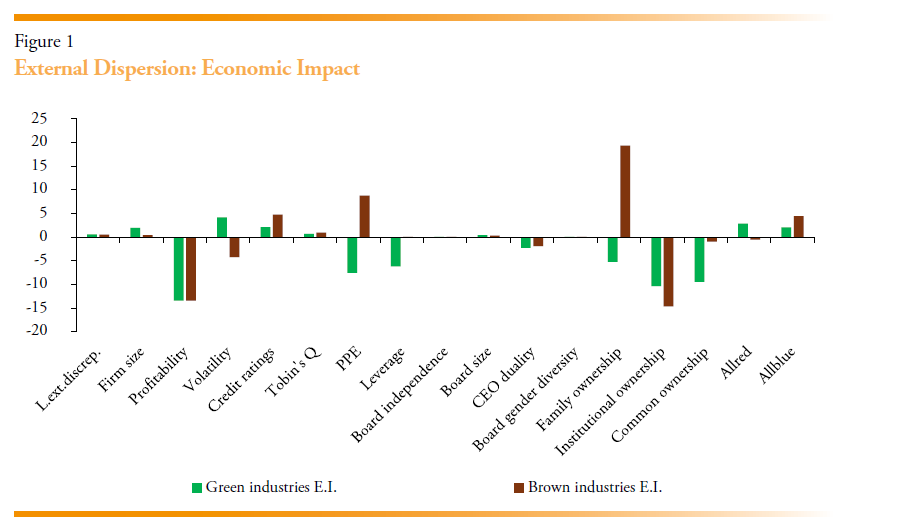
This section reports regression results for the U.S. 2002-2019 sample, distinguishing between green and brown industries based on unscaled greenhouse gas emissions. The dependent variable is external environmental rating dispersion, capturing disagreement in environmental (E) scores across rating agencies. External dispersion primarily reflects limits to comparability across rating providers. Although such disagreement may reduce transparency from a policy perspective, it may also reflect genuine uncertainty or alternative methodological interpretations of environmental performance. By contrast, internal dispersion need not be interpreted negatively: higher within-rater dispersion may reflect informative multidimensionality in environmental performance rather than measurement error. Accordingly, reducing external dispersion is a natural regulatory objective, whereas internal dispersion can contain economically meaningful information about environmental trade-offs. In the following Table, positive (negative) coefficients indicate higher (lower) dispersion. Statistical significance is denoted by *, **, and *** for the 10%, 5%, and 1% levels, respectively. The regression results are in Table 3. We also report the Economic Impact (EI) of each independent variable in both Table 3 and Figure 1. The EI illustrates the percentage impact on the dependent variable of a typical variation in the explanatory variable1.
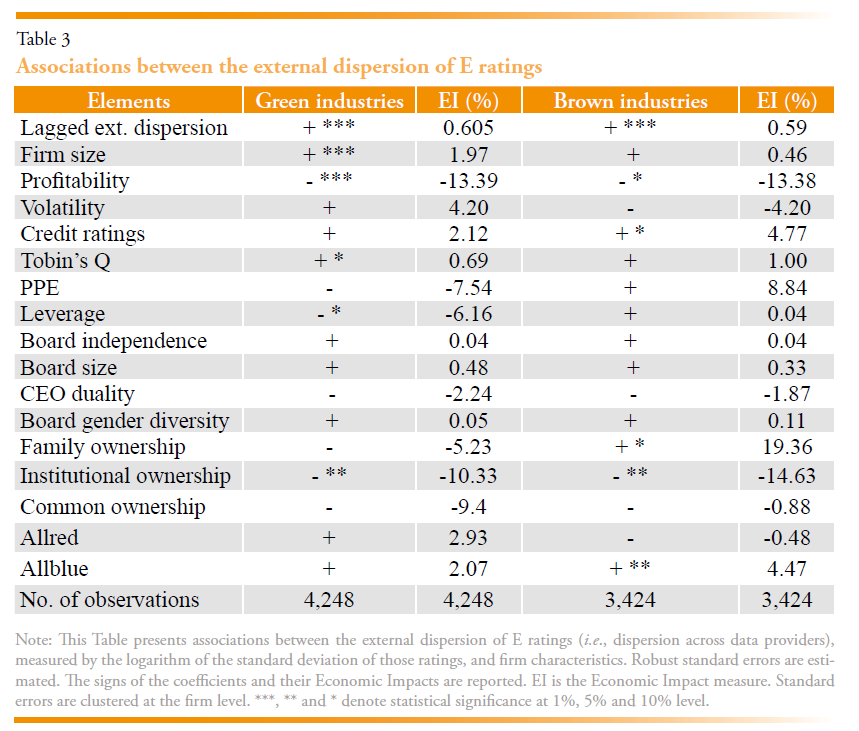
- Persistence of external rating dispersion
For both green and brown industries, lagged external discrepancy is positive and highly significant at the 1% level. This result indicates strong persistence in cross-rater disagreement across sectors with varying environmental intensity. External dispersion in environmental ratings, therefore, appears to reflect persistent information frictions rather than short-run fluctuations, even within a single regulatory setting. However, the EI is very low.
- Firm characteristics
Firm size is positively and significantly associated with rating dispersion (at the 1% level) in green industries, but not in brown industries. This result suggests that complexity-driven disagreement among raters is particularly pronounced in firms operating in environmentally friendly sectors, where boundaries and materiality may be less clearly defined.
Profitability is negatively associated with dispersion in both green (significant at the 1% level) and brown (significant at the 10% level) industries. More profitable firms exhibit lower cross-rater disagreement, consistent with clearer disclosure practices or more stable operational environments that facilitate convergence in environmental assessments. Credit ratings are positively related to external dispersion (significant at the 10% level) in brown industries only. In emissions-intensive sectors, stronger credit quality does not reduce rating disagreement; instead, raters may differ in how they incorporate financial strength alongside environmental impact and transition risk.
Tobin’s Q is positively associated with external dispersion (at the 10% level) in green industries, but it is not significant in brown industries. This pattern suggests that growth-oriented firms in cleaner sectors generate more divergent interpretations of forward-looking environmental strategies and commitments. Leverage is negatively related to dispersion in green industries (significant at the 10% level). Greater financial discipline among firms in environmentally friendly sectors may be associated with more standardized reporting or reduced ambiguity in environmental disclosures. Tangibility (PPE) does not present a meaningful impact.
- Ownership and governance characteristics
Institutional ownership is negatively and significantly associated with external rating dispersion (at the 5% level) in both green and brown industries. This result highlights the harmonizing role of institutional investors in reducing disagreement across ESG rating providers, irrespective of sectoral environmental intensity. Family ownership is positively associated with the external rating dispersion (significant at the 10% level) in brown industries only. This finding suggests greater heterogeneity in disclosure strategies among family-controlled firms operating in environmentally intensive sectors, where incentives to manage or selectively frame environmental information may be powerful. Other governance variables, including board independence, board size, CEO duality, and board gender diversity, do not exhibit statistically significant effects in these specifications, indicating that sectoral differences dominate governance mechanisms in shaping cross-rater disagreement.
- Political environment
The political context matters primarily for brown industries. Firms located in Democratic-governed states (Allblue) exhibit significantly higher dispersion (significant at the 5% level) in high-emission sectors. This result may reflect several mechanisms. Stricter environmental regulation and enforcement in Democratic-governed states may increase disclosure requirements and litigation risk, encouraging firms to adopt heterogeneous compliance and communication strategies. At the same time, rating agencies may differ in how they evaluate transition risk, regulatory exposure, and forward-looking environmental commitments. These factors can amplify interpretive divergence across providers in emissions-intensive sectors. No statistically significant effect of political affiliation is observed in green industries.
- Discussion and implications
Overall, the comparison between green and brown industries reveals both common and sector-specific drivers of environmental rating dispersion. Persistence and the disciplining role of institutional ownership are robust across sectors, whereas firm size, growth opportunities, leverage, family ownership, and the political environment matter in more targeted ways. Regarding the EI of the explanatory variables, profitability (-13%) and institutional ownership (-10%, -14%) exhibit strong effects, suggesting that these are critical factors explaining the external discrepancy. Interestingly, the extent of family ownership has different effects on EI in green (-5%) and brown industries (+19%), with the latter showing the stronger economic impact.
From an energy policy perspective, these findings underscore that improving the comparability of environmental ratings requires sector-sensitive approaches. In particular, emissions-intensive industries appear more exposed to political and ownership-related sources of disagreement, highlighting the importance of more explicit disclosure guidance and greater alignment in rating methodologies for brown sectors.
4.2. Internal Dispersion
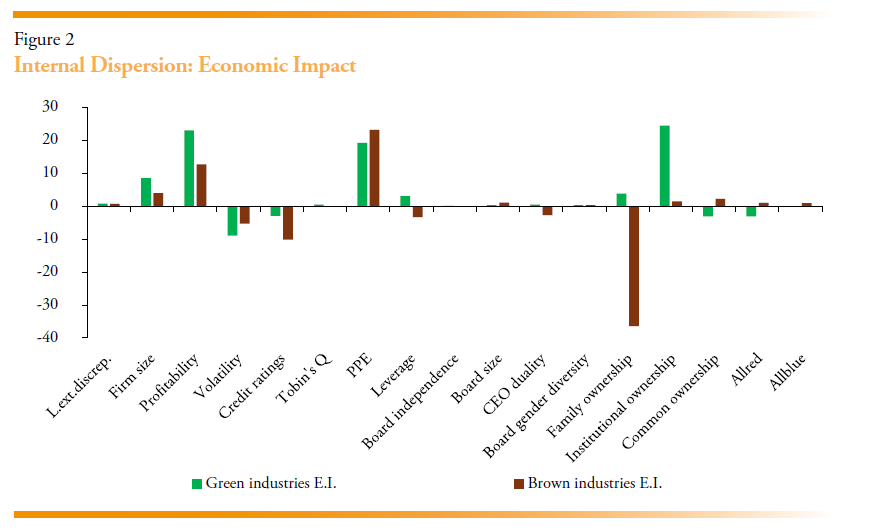
This section reports regression results for the U.S. 2002-2019 sample, distinguishing between green and brown industries based on unscaled greenhouse gas emissions. The dependent variable is internal environmental rating dispersion, defined as disagreement across environmental dimensions within a single rating provider’s assessment. Positive (negative) coefficients indicate higher (lower) dispersion. Statistical significance is denoted by *, **, and *** for the 10%, 5%, and 1% levels, respectively. The regression results are in Table 4. We also report the Economic Impact (EI) measure of each independent variable in Table 4 and Figure 2.
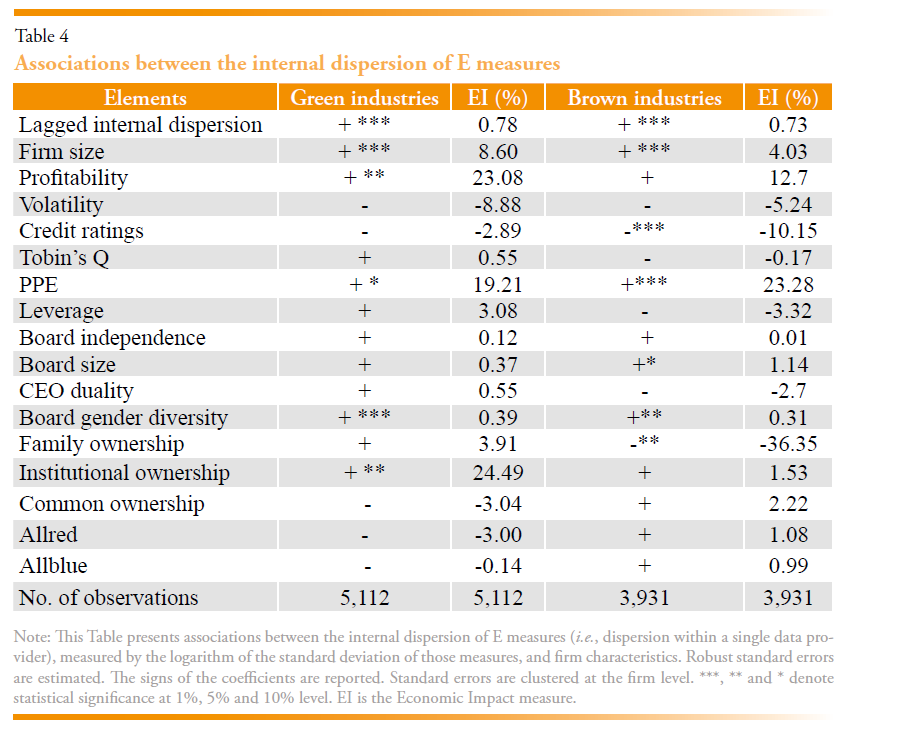
- Persistence of internal dispersion
Lagged internal discrepancy is positive and highly significant (at the 1% level) in both green and brown industries. This finding indicates strong persistence in within-rater disagreement over time, suggesting that internal dispersion reflects structural features of firms and rating methodologies rather than short-run fluctuations.
- Firm characteristics
Firm size is positively and strongly associated with internal dispersion (statistically significant at the 1% level) in both green and brown industries. Larger firms tend to operate across more heterogeneous activities and production processes, which naturally generates greater variation across environmental dimensions within a single rater’s assessment. Profitability is positively associated with internal dispersion (at the 5% level) in green industries, but not in brown industries. This pattern suggests that, in environmentally less intensive sectors, more profitable firms exhibit greater differentiation across environmental pillars, possibly reflecting selective strengths and weaknesses across distinct dimensions of environmental performance.
Credit ratings are negatively and strongly associated with internal dispersion (significant at the 1% level) in brown industries only. For emissions-intensive sectors, higher credit quality appears to be associated with more internally consistent environmental assessments, potentially reflecting standardized processes or clearer environmental risk management.
Property, plant, and equipment (PPE) is positively associated with internal dispersion in both green (at the 10% level) and brown (at the 1% level) industries. Asset-intensive firms are likely to face uneven environmental profiles across dimensions such as emissions, resource use, and operational efficiency, increasing within-rater dispersion.
- Governance and ownership structure
Board size is positively associated with internal dispersion (significant at the 10% level) in brown industries, suggesting that more complex governance structures may correspond to greater heterogeneity in environmental practices across dimensions in emissions-intensive sectors.
Board gender diversity is positively and strongly associated with internal dispersion in both green (significant at the 1% level) and brown (significant at the 5% level) industries. This result is consistent with the idea that more diverse boards emphasize a broader set of environmental objectives, leading to stronger differentiation across environmental dimensions within a single rater’s framework.
Family ownership is negatively associated with internal dispersion (significant at the 5% level) in brown industries. This finding suggests that family-controlled firms in emissions-intensive sectors tend to exhibit more internally uniform environmental profiles, possibly reflecting centralized control or more coherent environmental strategies.
Institutional ownership is positively associated with internal dispersion (significant at the 5% level) in green industries, whereas no significant effect is observed in brown industries. Institutional investors may encourage more granular, dimension-specific environmental reporting in cleaner sectors, thereby increasing within-rater differentiation across environmental pillars.
Regarding the EI of the explanatory variables, profitability (23%, 13%) is a relevant variable in explaining the extent of internal discrepancy, but its sign is opposite to that of external discrepancy. Tangibility (PPE) has a meaningful impact (19%, 23%), whereas institutional ownership (24%) in green industries and family ownership (-36%) in brown industries are critical values explaining the internal discrepancy.
Overall, the results indicate that internal environmental rating dispersion is systematic and persistent, with firm size and asset tangibility emerging as key drivers across sectors. Governance and ownership characteristics play a more nuanced role: board diversity and institutional ownership are associated with greater internal differentiation, particularly in green industries, while credit quality and family ownership reduce dispersion in brown industries.
4.3. Comparison of External versus Internal Dispersion
Taken together, the results reveal clear and systematic differences in the dispersion of external and internal environmental ratings. First, while both measures exhibit strong persistence over time, their determinants differ. External dispersion is more closely related to factors that complicate cross-provider comparability, such as firm size, growth opportunities, ownership structure, and the political environment. These results suggest that differences in methodological choices, aggregation schemes, and interpretations of forward-looking environmental information primarily drive cross-rater disagreement.
By contrast, internal dispersion is more strongly associated with firm-level heterogeneity in underlying activities and governance. Tangibility, defined as property, plant, and equipment divided by total assets (PPE), board gender diversity, and, in green industries, institutional ownership, is consistently linked to greater internal dispersion, indicating that within-rater variation reflects genuine multidimensional differences in environmental performance rather than pure measurement noise. At the same time, factors such as credit quality and family ownership reduce internal dispersion in brown industries, pointing to more uniform environmental profiles in firms with centralized control or standardized risk management.
Second, ownership structure plays opposite roles across the two concepts. Institutional ownership tends to reduce external dispersion while increasing internal dispersion. This pattern suggests that institutional investors are associated with clearer, more standardized disclosure that improves cross-rater comparability, while simultaneously encouraging more granular, dimension-specific reporting that sharpens within-rater differentiation across environmental pillars.
Overall, the contrast between internal and external dispersion underscores that environmental rating disagreement is not a monolithic phenomenon. External dispersion reflects limits to comparability across rating providers, whereas internal dispersion captures informative multidimensionality in firms’ environmental profiles. From a policy perspective, this distinction implies that efforts to improve ESG rating consistency should prioritize methodological harmonization across providers while preserving valuable within-rater information about trade-offs across environmental dimensions.
The reported associations should be interpreted with caution, as ownership structure, governance, and profitability may be endogenous to firms’ disclosure quality and ESG reporting infrastructure. For example, institutional investors may self-select into firms with more standardized environmental disclosure, while higher profitability may proxy for investments in internal reporting systems rather than directly affecting rating dispersion. Accordingly, the results describe systematic equilibrium patterns in environmental rating disagreement rather than causal effects.
5. CONCLUSIONS
This paper asks a simple but important question: when environmental (E) ratings disagree, what does that disagreement actually mean? We distinguish between two types. External dispersion occurs when different rating agencies give the same company very different environmental scores. Internal dispersion occurs when a single rating agency shows mixed performance across different environmental areas, such as emissions, resource use, or innovation. Using U.S. data from 2002–2019 and comparing industries with relatively high and low emissions, the evidence shows that external dispersion is greater in brown, high-emission industries, mainly due to ownership patterns and political factors, which create comparability problems. In greener industries, differences across raters are more closely linked to disclosure quality and institutional oversight. Within a single rating, green sectors show more variation across environmental areas, while brown industries tend to have more uniform internal scores.
We reach three main conclusions. First, disagreement in environmental ratings is not random or temporary. It is persistent over time, which means it reflects structural features of firms and rating systems. However, the source of disagreement matters. When ratings differ across agencies, the differences are often linked to company complexity, ownership structure, and political context. This result suggests that much cross-agency disagreement stems from differences in methodology, how agencies measure, weight, and interpret environmental information, rather than from fundamentally different views of the company’s actual environmental performance.
Second, disagreement within a single rating often tells a different story. When a company scores well in some environmental areas but poorly in others, this frequently reflects real trade-offs in how the firm operates. Asset-heavy firms, firms with more diverse boards, and in some cases, firms with strong institutional investor presence tend to show greater variation across environmental dimensions. This kind of dispersion may contain useful information about the complexity of environmental performance rather than simple measurement error.
Third, ownership structure plays a key role, but in opposite ways depending on the type of dispersion. Institutional ownership tends to reduce disagreement across rating agencies, likely because it encourages clearer and more standardized disclosure. At the same time, it is associated with greater differentiation across environmental dimensions within a rating, suggesting more detailed and granular reporting. This contrast highlights why it is essential to distinguish between different forms of rating disagreement.
The policy implications are clear. Not all rating disagreements are a problem. Efforts to reduce dispersion risk mixing up two very different issues. Policymakers should focus on improving transparency and consistency across rating providers, and especially in emissions-intensive sectors, so that investors are not confused by avoidable methodological differences. At the same time, regulation should avoid eliminating meaningful variation that reflects real environmental trade-offs within firms.
For investors, the message is equally important: a single ESG score does not tell the whole story. Understanding why ratings differ is crucial for sound capital allocation. For managers, clearer and more structured disclosure can reduce cross-agency disagreement while still reflecting environmental strengths and weaknesses.
Like all research, this study has limitations. Our classification of industries is based on emissions and focuses on U.S. firms. Future research could explore alternative definitions of environmental intensity and other regulatory contexts. It would also be valuable to examine how markets respond differently to external versus internal rating disagreement.
In short, disagreement in environmental ratings is not automatically a flaw. Sometimes it reflects inconsistent measurement; sometimes it reflects real complexity. Recognizing the difference is essential for building more credible ESG frameworks, designing better regulation, and making more informed investment and corporate decisions.
REFERENCES
Avramov, D., Cheng, S., Lioui, A., Tarelli, A. (2022). Sustainable investing with ESG rating uncertainty. Journal of Financial Economics, 145, 2, Part B, 642-664.
Berg, F., Koelbel, J., and Rigobon, R. (2022). Aggregate confusion: The divergence of ESG ratings. Review of Finance 26(6), 1315–1344.
Billio, M., Costola, M., Hristova, I., Latino, C., & Pelizzon, L. (2021). Inside the ESG ratings: (Dis)agreement and performance. Corporate Social Responsibility and Environmental Management, ٢٨(5), 1426–1445.
Chatterji, A., Durand, R., Levine, D., and Touboul, S. (2016). Do ratings of firms converge? Implications for managers, investors, and strategy researchers. Strategic Management Journal, 37(8), 1597-1614.
Christensen, D. M., Serafeim, G., and Sikochi, A. (2022). Why is Corporate Virtue in the Eye of the Beholder? The Case of ESG Ratings. The Accounting Review, 97(1), 147–175.
Di Giuli, A., and Kostovetsky, L., (2014). Are red or blue companies more likely to go green? Politics and corporate social responsibility. Journal of Financial Economics, 111, 158–180.
Edmans, A. (2023). The end of ESG. Financial Management, 52, 3–17.
Gibson, R., Glossner, S., Krueger, P., Matos, P., Steffen, T. (2022). Do Responsible Investors Invest Responsibly? Review of Finance, 26(6), 1389–1432.
Gibson, R., Krueger, P., and Schmidt, P. S. (2021). ESG rating disagreement and stock returns. Financial Analysts Journal, 77, 104–127.
Huber, B. M., and Comstock, M. (2017). ESG Reports and Ratings: What They Are, Why They Matter. Harvard Law School Forum on Corporate Governance and Financial Regulation.
Kotsantonis, S., and Serafeim, G. (2019). Four Things No One Will Tell You About ESG Data. Journal of Applied Corporate Finance, 31(2), 50-59.
Pedersen, L. H., Fitzgibbons, S., and Pomorski, L. (2021). Responsible investing: The ESG-efficient frontier. Journal of Financial Economics, 142(2), 572-597.
Peña, J. I., Desender, K. A., and Guo, B. (2025). Divergence and Uncertainty in ESG Markets: Metrics, Economic Policy, and Financial Implications. Estudios de la Fundación. Serie Economía y Sociedad. Funcas.
Raghunathan, T. (2003). An Approximate Test for Homogeneity of Correlated Correlation Coefficients. Quality & Quantity, 37, 99–110.
Sautner, Z., Van Lent, L., Vilkov, G., and Zhang, R. (2023a). Firm‐level climate change exposure. The Journal of Finance, 78(3), 1449-1498.
Sautner, Z., Van Lent, L., Vilkov, G., and Zhang, R. (2023b). Data for ‘Firm-level Climate Change Exposure. https://doi.org/10.17605/OSF.IO/FD6JQ
Serafeim, G., Yoon, A. (2023). Stock price reactions to ESG news: the role of ESG ratings and disagreement. Review of Accounting Studies, 28, 1500–1530.
Wong, C., Nelson, J., and Brackley, A. (2023). Rate the Raters 2023: Expert Views on ESG Ratings. https://www.sustainability.com/globalassets/sustainability.com/thinking/pdfs/2023/rate-the-raters-report-april-2023.pdf
Zoeller, T. (2025). Homogeneity test for multiple correlation coefficients (https://www.mathworks.com/matlabcentral/fileexchange/25367-homogeneity-test-for-multiple-correlation-coefficients), MATLAB Central File Exchange.
NOTES
* We acknowledge research assistance from Jack Louis Christie and financial support from FUNCAS through the ESGPE 2024/00644/001 grant. We thank the Editor, Pedro Linares, for useful comments.
** Universidad Carlos III de Madrid, Department of Business Administration, ypenya@eco.uc3m.es
*** Universidad Carlos III de Madrid, Department of Business Administration, kdesende@emp.uc3m.es
**** Universidad Carlos III de Madrid, Department of Business Administration, bguo@emp.uc3m.es
1 The Economic Impact (EI) metric measures the practical influence one variable has on another. In other words, it illustrates the percentage impact on Y of a typical variation in X. The higher the EI, the more relevant the explanatory variable is in explaining variations in the dependent variable. This metric helps prioritize which variables are most important for business decisions, policy changes, or resource allocation. A variable might be statistically significant but have a low Economic Impact coefficient, or vice versa.