

Renewable electricity contracts: lessons from European experience
Renewable electricity contracts, Variable Renewable Electricity (VRE)
Mats Kröger* and David Newbery**
Papeles de Energía, N.º 24 (febrero 2024)
In response to commitments to massively increase Variable Renewable Electricity (VRE) and to reduce the cost of financing capital-intensive low-variable cost VRE the EU Commission requires that all future support payments must come through two-sided Contracts for Differences (CfDs). This article compares the extent to which current and proposed future European CfDs deliver efficient investment and operating signals. It confronts these design options with wholesale price data from Germany, Spain, and Great Britain to see how they score in reducing risk and hence finance cost while delivering efficient investment and operating decisions at least cost to consumers.
1. INTRODUCTION◆
The Paris COP21 of 2015 was agreed by 196 Parties and came into force in November 2016.1 Each signatory announced Nationally Determined Contributions (NDCs) that set out their approach to reducing emissions. The logical priority is to decarbonise electricity, which in most countries will require a massive acceleration of Variable Renewable Electricity, VRE (i.e., wind and solar PV). These technologies have high capital costs and very low variable costs, so their cost depends almost directly on the cost of finance. Reducing the weighted average cost of capital requires reducing risk over the extended period needed for cheaper bond finance. This article considers the design of suitable long-term contracts, and draws on lessons learned from the range of such contracts to be observed in Europe. The EU Commission stated in 2023 that all future support payments for the construction of renewable electricity must come through two-sided Contracts for Differences (CfDs),2 a trend already underway in countries such as the United Kingdom, Ireland and Spain and the focus of this article.
1.1. Risks facing generators
Dispatchable generators face price risk to which they can respond by adjusting their output – if prices are above variable cost, they can sell their full potential output and earn the difference between price and cost, while if prices are below variable cost they can stop producing and avoid losses. Their revenue is thus exposed to price risk. In Europe, the variable costs are primarily driven by the gas plus carbon prices or coal plus carbon prices, whose costs tend to move together (primarily driven by the ease of switching between coal or gas-fired generators). As a result, wholesale prices and fuel prices also move together and constitute a natural hedge. Vertically integrated utilities have the further advantage of passing on cost changes in retail prices, as their competitors also face similar cost movements.
In contrast, Variable Renewable Electricity (VRE, wind and solar PV) generators have low variable costs (zero in the case of PV) but they can only produce if the wind blows or the sun shines, so they are exposed not just to price risk (with no natural hedge via fuel price co-movements) but also to volume risk. With high levels of VRE penetration, volume and prices will be increasingly negatively correlated, as a high VRE output will depress wholesale prices while low VRE output will require expensive alternative source of supply. Aggregate revenues should therefore be less volatile than either prices or outputs, although revenues from individual producers will be more volatile than the average. Green and Vasilakos (2012, GV) simulate the impact of high levels of wind on wholesale prices for a run of 12 years. They find that individual on-shore wind farms have a range of annual revenues about one-third of average revenues (GV figure 6 and p3217), while for Great Britain as a whole the range for all on-shore wind together is 7% for the competitive case and 10% for the duopoly case (GV Table 3).
However, at modest levels of penetration this negative correlation will be muted, and revenue volatility will be more influenced by output variability. This can be exemplified using Scottish data.3 For individual Scottish wind farms the coefficient of variation (CV) of annual average capacity factors (i.e., the relation between potential and actual output) varies from 12-19% over time while for Scottish wind as a whole the CV is 11%. More relevant for the extent to which wind farms can use debt finance, the minimum annual output of an individual wind farm can be as low as 60% of the average, but for Scottish wind as a whole (2002-2022) this rises to 75%. Individual VRE thus faces a mixture of idiosyncratic and correlated risk, and that will be relevant for designing hedges.
1.2. Hedging contracts
Contracts for differences have long been used by conventional controllable generation as a financial instrument to hedge risks that were introduced by vertically separating generation from retailing. Under vertical integration cost changes upstream can be readily passed through to final consumers, and any contracts with customers can be hedged by comparable duration fuel hedges. Vertical unbundling breaks that link so that cost changes upstream lead to wholesale price fluctuations which impact retailers when buying. The logical risk-sharing hedge between generators and retailers is a two-sided CfD.
The standard two-sided CfD is a financial contract that specifies an amount, M, (MW), a strike price, s, and a reference market price, p, (usually the day-ahead hourly wholesale price). The generator receives (or pays, if negative) (s – p).M per hour. A base-load contract would be at the same strike price for every hour of the day for a month, quarter, or year, while peak hours or 4-hour time slots can be used to match demand patterns. The generator makes its output decision looking purely at avoidable costs and potential revenues. If it is unprofitable to produce, the spot price p must be below the avoidable cost, c. It must also be below the strike price s so the generator receives (s – p).M. If the generator had to produce to receive its CfD payment it would receive the smaller amount (s – c).M per hour. It thus avoids losing c – p per MWh. Generators with and without CfDs will all be dispatched efficiently, based on the merit order of avoidable cost. The CfD is a purely financial contract that requires transfers between the parties regardless of whether the generator produces or not, and its standard format makes it suitable for trading in liquid contract markets.
As noted above, fossil generators are largely hedged by the tight relationship between fuel and electricity prices. As such fossil generators have little need for long-term contracts, particularly as now there is little call for investment in the more durable and capital-intensive coal plant. For new flexible capacity that may be needed to deliver security of supply, capacity markets can offer suitable long-term contracts, which have the added benefit of hedging consumers against high wholesale prices.
Retailers are also reluctant to hedge long-term as their customers can readily switch suppliers. Retailers with what turn out to be expensive contracts risk customer desertion to retailers who chose not to enter into such contracts in times of low prices. The reluctance of regulators to allow retailers to lock in customers for lengths comparable to their contract horizon has put downward pressure on the length of such contracts. Therefore, long-term contracts signed in capacity auctions typically require a government or regulatory-backed counterparty in the absence of credible private counterparties.
Existing liquid and relatively short-term contracts are quite unsuited to financing durable capital-intensive low-carbon technologies like VRE, while capacity contracts are intended for dispatchable plants. The same is true of financing new nuclear power plants as they also lack the natural hedge of co-movements of fuel and electricity prices (Roques et al., 2006, 2008).4 Nuclear power faces additional political, regulatory and construction risks that are not the subject of this paper and will hence be ignored. The second reason for requiring long-term contracts for VRE is that future wholesale electricity prices are increasingly subject to unpredictable political interventions, such as changes in the determination of carbon prices, changes to zonal (or possibly future locational) pricing, and changes in the commitments to the volume of VRE entering as national commitments are tightened. Third, for VRE, a standard baseload CfD exposes the VRE to substantial volume risk, as its output cannot be reliably forecast more than a few hours ahead. Low VRE output would require the generator purchasing wholesale power when prices are high (as VRE supply is low) while surplus VRE would be sold at low prices (as VRE supply is high). Fourth, until recently the required strike price to commercialise VRE has been above expected wholesale prices and hence there would be no commercial demand as a counterparty to such contracts. Finally, as stressed above, VRE has high capital costs but low operating costs, so the cost of finance is the main determinant of the cost of VRE output. Risk, unless adequately hedged, raises the cost of capital, so a contract that delivers a predictable future revenue stream for the tenor of bond finance is critical to enable mostly low-cost debt finance.
All of these reasons conspire to create a demand for a new type of low-risk long-term contract for low-carbon generation. For VRE as noted a standard CfD is quite unsuitable, even when the required strike price becomes competitive with other generation. Other contract forms have therefore been designed. This article draws lessons from the variety of VRE contracts that have been tried and proposes more appropriate designs for the future.
2. CURRENT VRE CONTRACT DESIGNS
In Europe, there are currently four dominant types of renewable energy support mechanisms (if we ignore scarcely used investment grants). These are feed-in-tariffs, fixed premiums, sliding premiums/CfDs and green certificate schemes. Initially the relevant price was frequently set administratively but increasingly competitive tendering processes such as auctions have shown their clear advantages and have largely replaced administered prices (CEER, 2023, table 1). The various contractual forms have been extensively surveyed (e.g., by Ragwitz and Steinhilber, 2012; more recently by Abrell et al., 2019; Meeus et al., 2021 and Newbery, 2023). The Congressional Research Service (2013) provides a detailed briefing on EU wind and solar electricity policies.
2.1. Level of VRE support in European countries
The Council of European Energy Regulators, CEER, provides periodic Status Reviews of renewables support schemes (see e.g. CEER (2015, 2018, 2021, 2023)). They show the extent to which renewable energy support has been deployed in Europe. By the end of 2020 280 GW of wind and PV producing an output of 455 TWh received support (CEER, 2023, tables 3, 4). In 2021 the weighted average support for all technologies was €83/MWh, a reduction from 109 €/MWh in 2020 as a result of higher wholesale prices. “Solar PV still had the highest average support level in 2021 with around 136 €/MWh followed by bioenergy with 69 €/MWh.” (CEER, 2023, p. 27). Much of the high average cost of support is the result of legacy contracts signed when VRE costs were considerably higher. Newbery (2023, tables 1 and 2, p. 5) show that in 2013 54% of total support went to feed-in-tariffs, and 46% to feed-in premiums and green certificates. Support costs have fallen significantly. Between 2013 and 2019 the support cost of PV fell from €320/MWh to €227/MWh and for on-shore wind from €51/MWh to €48/MWh. By 2021 the support costs for PV were €220/MWh, for on-shore wind €26/MWh and for off-shore wind €96/MWh (CEER 2023, tables 5 and 10). The range of support between countries is substantial. For new PV first operating in 2020 the range is €249/MWh to €7/MWh and for on-shore wind from €60/MWh to €7/MWh (CEER, 2023, tables 15 and 16).
During the energy crisis, rising wholesale prices and fixed strike prices turned subsidies into profits in many cases. In the UK on-shore wind needed €60/MWh subsidy in 2021 but paid back €16/MWh in 2021. Thus, the renewable energy support schemes helped to stabilize electricity prices in some countries. However, whether this happened very much depended on the choice of instrument.
2.2. Types of renewable electricity contracts
A feed-in-tariff (FiT) sets a price for every MWh injected and metered and requires no marketing activity by the generator. Fixed premium schemes add a fixed premium on the wholesale price, while green certificates have a similar function, adding the value of the certificate to the wholesale price, but often with the certificate having a market-determined value created by an obligation on retailers to buy certificates to a certain fraction of their retail sales. Both contracts requite the VRE generator to sell the output on the wholesale market (unless they sign a contract with an off-taker to perform that task) and are volatile (reducing their risk-reducing benefits). They leave counterparties (usually customers) exposed to high wholesale prices. As such they had already fallen out of favour (e.g., the UK abandoned its Renewable Obligation Scheme in the 2013 Energy Act, HoC, 2013), while the recent energy crisis sounded their death knell.
The EU has in its recent policy proposals announced that a specific form of sliding premiums, a form of two-sided CfD (in the UK termed a CfD with FiT), is supposed to become the sole mechanism of providing public support for renewable energy. As a rule, this CfD pays a strike price on metered (not pre-determined) output and so it is a physical, not financial hedge like the standard CfD. They are also for lengthy periods (10-20 years) and the strike price may be indexed to the price level or fixed in nominal terms. Given their increasing importance for supporting VRE, this article considers the range of CfDs adopted by various countries, to compare their strengths and weaknesses and draw lessons for improving future VRE contracts.
3. CRITERIA FOR COMPARING RENEWABLES CONTRACTS
A good renewable electricity contract should incentivise the producer to choose an efficient location (with adequate transmission capacity, good resource characteristics bearing in mind correlations with other VRE and the local price), the correct technology (best suited to the resource as well as the market design, e.g., the height of the wind turbine or the orientation of the PV panels to maximise revenue not output) and then to respond efficiently to spot prices (e.g., by not offering bids below avoidable cost, and offering regulation-down services). Contracts that do not discourage VRE from locating behind transmission constraints and which fully compensate for curtailment are problematic. A good contract should limit consumer exposure to the subsidy cost by not over-rewarding producers in high resource areas and not over-reward when wholesale prices are high. Part of minimising the cost to consumers is to reduce the incentive for commercial agents to attract the least-cost supplies leaving the public to pick up the remaining more expensive projects, although this is only likely to affect a small fraction of the market and if additional to existing targets could increase total VRE. In this context there should be sufficient but not excessive incentives to invest, which is an argument for auctions rather than administratively set prices. As many dominant generating utilities also invest heavily in VRE, the contract design should not amplify market power (Fabra, 2023). Finally, to minimise the cost of finance the contract should reduce revenue risk as far as is consistent with achieving all the other desirable features, and, if possible, not adversely impact liquidity in the market for hedging wholesale price volatility.
Some of these desirable features immediately rule out premium FiTs, green certificates and one-sided CfDs, which have allowed holders to reap immense profits when wholesale prices reached levels multiples of times those historically experienced and which were unexpected when the original contract was agreed. The design of contracts should be resilient to such shocks.
4. CONTRACT-FOR-DIFFERENCE DESIGNS: CURRENT MODELS
A number of key design features will directly affect the cost of support and the extent of risk reduction, while others will either incentivise or discourage suitable responses to short-term market signals.
4.1. One or two-sided CfDs
Among CfDs, the first critical determinant of support cost is whether the CfD is two-sided or one-sided, leaving the producer to reap all the upside in high price periods. A premium FiT or Feed-in Premium also has this undesirable property. The attraction to governments of issuing such contracts is that they should lead to a lower strike price and so in normal times can appear cheaper, but at the cost of potentially very high subsidies in high price periods.
Table 1 describes the design of CfDs in some of the largest European economies that employ such contracts. It shows that one-sided CfDs are relatively unusual, and at least in The Netherlands the payment that is made to the generator in times of low electricity prices is restricted while the strike price can depend on the resource quality.5 In Austria, one-sided CfDs are only used for small-scale installations.
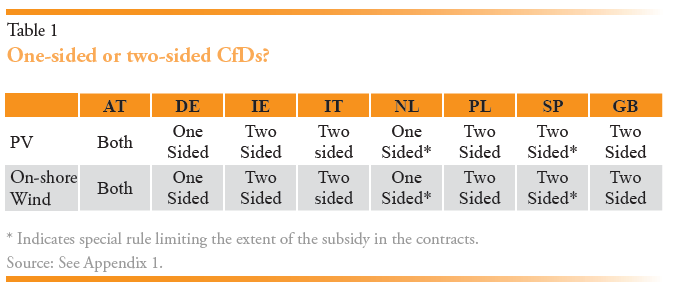
Such one-sided CfDs are the inverse of a Reliability Option (RO) used as a Capacity Remuneration Mechanism in some countries such as the island of Ireland. An RO sets the strike price, s, slightly above the highest avoidable cost of any controllable generator accepted into the auction to determine the payment to generators for accepting the RO contract. In return they must pay back Max[(p – s).M, 0] whether or not they are able to generate, making a non-generation potentially very costly. The attraction of an RO is that it limits consumer exposure (as they pay no more than s) while making a capacity payment for 10-15 years to encourage investment in flexible generation. In contrast if the holder is protected against low prices but keeps all the high price revenue then consumers are disadvantaged.
4.2. Defining the reference price
The other key element in all CfDs is the reference price, which could be the hourly price or some longer-term average, in which case the average would normally be weighted by the output of the relevant technology. The average price is then also called the “market value” of the technology. Table 2 shows that hourly prices are the most common.
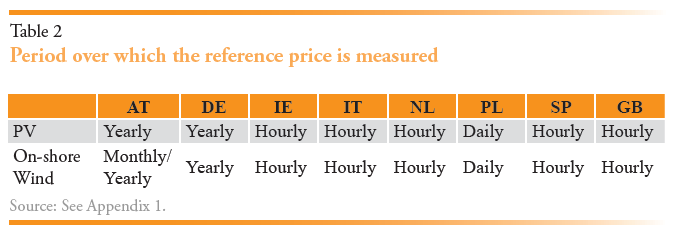
The choice of reference period has implications for the operational incentives of a CfD that pays on metered output. If the reference price is the hourly day-ahead price this creates, without further rules, a “produce and forget” incentive, i.e., renewable energy producers do not have any incentive to react to electricity prices. If the reference price is equal to the average market price over a longer period (e.g., week or month) this restores the incentive to produce at high price hours since it allows producers to “beat the market” if the project’s market value (i.e., the average market price weighted by their individual production in each hour) is higher than the average market value of the technology. This provides incentives to perform routine maintenance in periods of predicted low prices. If the reference price is weighted by the country-wide PV or wind production, and if high VRE lowers prices, then an average reference price provides incentives to locate where VRE output (and hence prices) are less correlated with the country average.
However, as Schlecht et al. (2023) discuss, the longer reference period introduces problems of its own by distorting the dispatch incentives in the day-ahead market. Thus, if the average reference price is €130/MWh and the strike price is €80/MWh the VRE will have to pay €50/MWh if it operates but zero otherwise. If the market price in that hour is only €40/MWh it will be unprofitable to run, even though it would be economically desirable. The choice of reference period should weigh the benefits against the cost of any distortions.
4.3. Indexing strike prices or not?
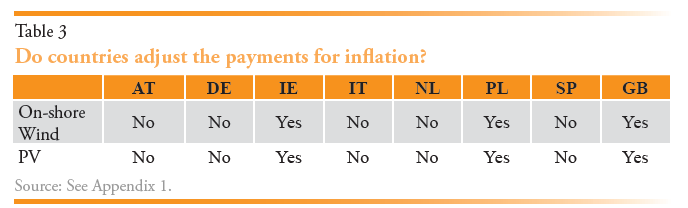
Indexing strike prices to inflation in principle allows the investment to be financed with indexed bonds whose rate of interest will be lower (by the expected rate of inflation). However, a justification for not indexing is that most bonds are defined in nominal terms and may confer tax advantages compared with indexed debt. With inflation the real cost of support would then fall over time, tracking the likely fall in the real cost of most VRE. If debt payments, which are a large share of the cost of a renewable energy project, are defined in nominal terms an inflation indexed CfD would increase the profits of the installation in real terms in later years of project operation, deferring the gains. The strike prices will be higher if the payments are not indexed, even if the present discounted value in constant prices might be the same as if the strike price were indexed, so current subsidies would appear higher, while past subsidies would be lower.
Table 3 shows that most EU countries in our sample do not index CfDs. GB has always indexed regulatory contracts for network utilities (and has a thriving index bond market) and appears to have adopted the same indexing without considering the case for nominal bond finance and the excess incentive to locate in high resource areas that may require more costly network investment and risk local saturation.
4.4. Adjustment of payment by resource quality
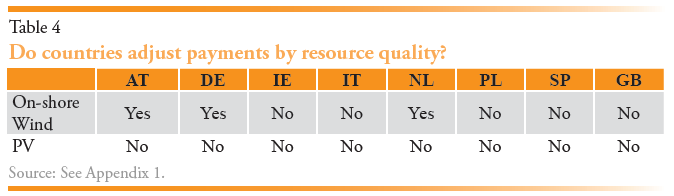
Another possibility is to adjust the payments by the quality of the resource (e.g., full operating hours per year) and so make payments closer to cost and reduce producer rent.
In Austria, The Netherlands and Germany, the strike price is set by an auction with adjustments (positive and negative) according to the resource quality in the local region, measured by full operating hours per year. If installation costs are fairly site-independent, all producers will eventually recover the same revenue and hence all cover their cost, if the adjustments are appropriate. The problem is that producers in resource-rich areas may prefer Power Purchase Agreements with large credit-worthy companies, whose aim is to buy “green” electricity, which, if publicly sourced, would be at the cost of the average resource and more expensive.
If transmission charges reflect the full cost of delivering VRE output to load, and if VRE is located in distant or export constrained areas, then some of the distortion of paying the same price per MWh everywhere and paying for curtailed hours might be reduced. British Generation Transmission Use of System Charges attempt to do this by setting charges at the long-run marginal cost of accepting an extra MW at that node given the load that the generating technology places on the system (i.e., whether it generates on baseload or not). The cost attribution is imperfect as the charges are only slowly adjusted to new patterns of investment and assume the lines can be instantly and incrementally expanded, but they do reduce excess rent from wind to some extent. If the charges for existing generation were kept as at present but all new connections were given long-term contracts reflecting the true cost the entrant places on the system (strictly, the hub or system average price less the spot scarcity value of the generation at that node, as forecast for the next 15 or so years) then locational signals would be improved and more of the excess rent removed.
The simplest way to remove much of the excess rent is to limit the period of support to full operating hours (MWh/MW) rather than calendar time, so that resource rich areas will pay back the same undiscounted revenue as resource poor areas, although its discounted sum will be slightly higher (and the subsequent market revenue would also be higher). If the construction costs are similar in different locations then the support offered would be more closely matched to the cost, with lower excess rent. Locational grid charges will also have the desired effect rather than support amplifying revenue and possibly acting against these locational signals.
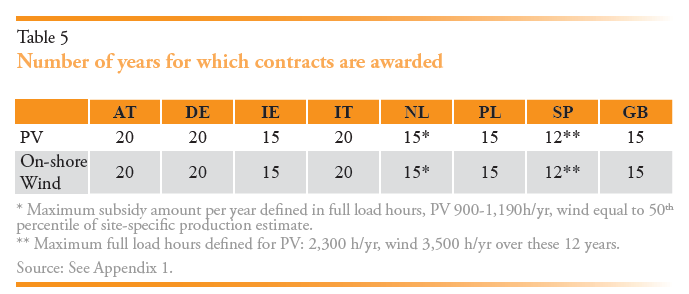
4.5. Duration of the contract and maximum covered output
The length of the contract affects its risk and hence finance cost. Most contracts are for between 12-20 years. However, in some cases the duration is not measured in years but instead by total full operating hours as a way of limiting excess rent as in The Netherlands and Spain in Table 5. In these cases, payment can continue until the elapse of a specified number of full operating hours as discussed in §6. This leads to the duration of the contract varying with the capacity factor. Thus 40,000 MWh/MW would be paid back in 20 years at 2,000 hrs/yr or 10 years at 4,000 hrs/yr. It has the merit of assuring the revenue to be repaid while incentivising the VRE to deliver the desired output and not giving excessive subsidies to VRE in resource rich areas.
If the contract duration is limited by a number of operating hours, this leads to a considerable reduction in risk level by resource quality. Regardless of resource, developers can take on comparable levels of debt (guided by annual output variability) with tenors linked to the expected duration of the contract – longer for an installation with lower resource quality, shorter for higher resource quality. Revenues earned after the end of the contract can be paid to equity as the plant then becomes exposed to market risk (unless subsequently hedged), but at terms hard to estimate a decade earlier.
4.6. Payments in hours of negative prices
In order to avoid inefficient incentives, some contracts suspend payment to the generators at times of negative prices and the shorter the period before ending payment the stronger the signal. Table 6 shows the results for selected countries for which the data are available.
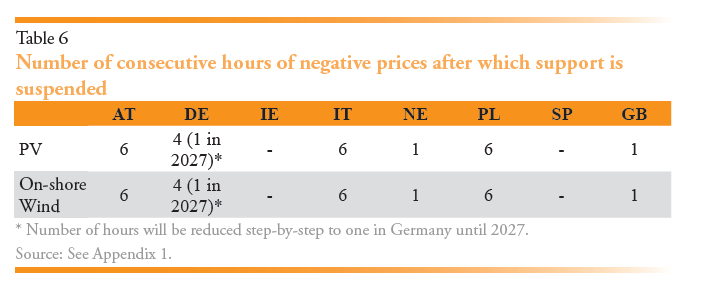
Some countries like New Zealand also prohibit VRE from negative price bidding so VRE would not be dispatched in negative price hours. These rules aim to dissuade producers from producing electricity in hours in which the production would have to be curtailed and can encourage location in areas with adequate transmission capacity. Thus, it aims to establish efficient operational and investment incentives.
4.7. Payment if curtailed
If payment is on metered output and the VRE is curtailed (typically because of transmission constraints), then it matters whether or not the VRE has firm access rights, entitling it to compensation if curtailed, or non-firm access rights with no payment if not dispatched (as in the Australian National Electricity Market). In many countries (e.g. UK) generators holding premium or one-sided CfDs are allowed to bid negative prices to remain on the system, and to receive payments on their metered output. This can distort the choice of plant needed to balance the system as it may be cheaper to curtail a fossil generator with significant avoidable costs rather than a VRE with zero avoidable cost. With a two-sided CfD the compensation may be the original contract but on the offered, not dispatched, volume. This at least ensures an efficient choice in the balancing market. In Denmark the hybrid VRE CfD does not pay if market prices are negative (Schlecht et al., 2023).
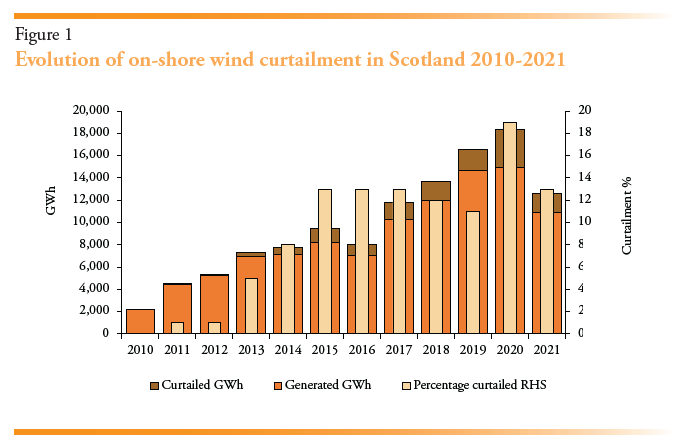
Curtailment will rapidly rise if the COP28 target of a trebling of renewable electricity by 2030 is as widely delivered as pledged. Marginal curtailment (that is, the loss of output of the last MW to enter) is 3+ times as high as average curtailment (Newbery, 2023) and is already a serious problem in export constrained areas like Scotland. Figure 1 shows both the amount and the percentage of output of Scottish on-shore wind farms from 2010-2021, reaching a high on 19% in 2020 (2021 was a lower wind year).
Paying for curtailed VRE removes the incentive to locate in areas with adequate export capacity. If the contract length is specified in terms of delivered MWh/MW then in effect curtailed VRE would only be compensated at the end of the contract, providing some incentive to locate more efficiently. Eirgrid (2022) has proposed that new VRE entering in constrained locations will have non-firm access rights (i.e., if curtailed will not be paid) until the network is reinforced, or after five years, whichever is sooner. Alternatively, the transmission owner could signal where to locate by offering higher cost transmission charges in constrained areas (effectively reflecting the locational price difference between that node and the hub or country load average location).
5. PROPOSALS FOR IMPROVING CFDS6
Current CfD designs using metered output have, if the reference period is hourly, the problem of providing “produce and forget” incentives under which developers have no incentive to react to market prices. Therefore, an increasing number of commentators have argued against making the contract payment contingent on metered output (Barquín et al., 2017; Huntingdon et al., 2017, p. 479; Newbery, 2021; Schlecht et al., 2023).
In order to do so, the CfD with FiT contract, as it is currently used in the UK, can be revised easily to avoid these problems by copying the format of conventional Contracts for Difference (CfDs) described above. The solution is to make the contract payable not on metered output, but on day-ahead forecast output of that technology at that location. The developer would designate a preferred forecasting agency to provide day-ahead hourly forecasts of the capacity factor θrh for its own technology (e.g., by using power curves and wind forecasts) at its location r in hour h. The generator would secure a yardstick contract in the periodic renewable auction at the strike price s for capacity K. The proposed yardstick CfD (YCfD) would pay (s – prh)θrhK when the spot price is prh (in hr h, location r).7
This yardstick contract would be specified for a fixed number of full operating hours, rather than fixed number of years, as described above. The combined result of these two changes would be a YCfD that would pay (s – prh)θrhK when the spot price is prh (in hr h, location r) for the first N MWh/MW (i.e., full output hours), where prh indicates that if at some date nodal pricing is introduced (discussed below) the contract would not need changing (Newbery, 2022).
Most variants differ in how the contract cover is defined – whether on forecast output, a reference set of comparable VRE in the same region, or from local wind speed or solar isolation converted into potential output using the VRE technology specification, but they all share the key characteristic of delinking actual marketed output from potential output. A further choice is whether curtailed output is paid or handled through a MWh/MW contract) and that is essentially an access decision – whether firm (and hence compensated) or non-firm and not compensated).
Another method of delinking output from contract support is the Financial CfD (Schlecht et al., 2023) and the Capability-based CfD (Scott and Morawiecka, 2023). In case of the Financial CfD fixed payments are made for a certain period of time (provided the VRE is demonstrably producing), in an amount per MW set in an auction. In return the VRE would pay back the output of a reference plant at the market price, providing strong incentives to produce at the maximum possible rate. Presumably it would be possible to declare non-availability for maintenance, failure, or curtailment up to some number of hours per year. In the capability-based CfD the contracted production is that of a reference plant under the weather conditions of the location, rather than the actual production of the turbine.
6. TESTING DIFFERENT CONTRACT TYPES AGAINST MARKET DATA
The choice of how to design contracts for differences has important implications for the objectives outlined in Section 3. While some contract structures better incentivize the efficient location or technology choice, other contract structures provide better production incentives. The choice of contract also determines how much risk to allocate to both consumers and producers of electricity.
6.1. Approaches for comparing CfD designs
It is not immediately obvious how to compare different contracts as they are intended to support VRE in as yet unknown future market conditions in different locations in different countries under future market designs. Clearly all the contract options must be tested against the same scenarios (of wholesale prices, VRE outputs, and other country-specific features such as network charges). Probably the most satisfactory method would be to take the last four years of market price data (as it includes periods of low and very high prices) and then simulate future possible price trajectories under a range of scenarios (of VRE expansion, fuel and carbon price forecasts, market design options). A good example of this approach is provided by FTI (2023) who simulated 2025-2040 GB market design options at a highly granular level (800 nodes). This was a major undertaking using Plexos software and well beyond our modest capabilities. Green and Vasilakos (2010) were able to test out the impact of a substantial expansion of wind on the GB wholesale electricity market by using supply function methods to simulate equilibrium prices for a modelled 2020 year using wind profiles for the years 1992-2005 (sufficient to cover a wide range of possible profiles). Mendes et al. (2023) show how the price modelling can be improved without recourse to the massive and expensive Plexos software.
6.2. Assumptions
Instead, this article adopts a relatively crude approach using actual wholesale price data for the four years 2019-2021 (which include a considerable range of price levels and VRE outputs). This is a limited test in that it does not simulate the impact of high future VRE penetration, network enhancements, and future possible fuel and carbon prices, but it can at least illustrate how well the contract options compare in near term possible market conditions.
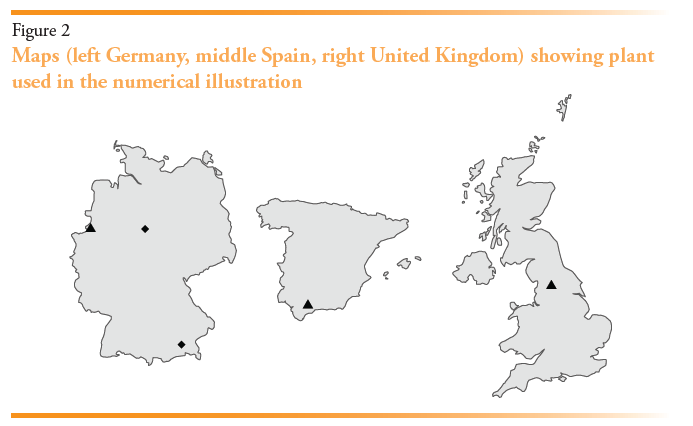
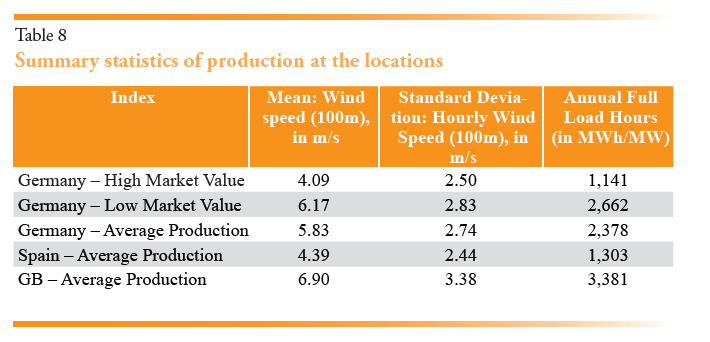
To illustrate the effect that different contract types on revenue and risk, we analysed three exemplary on-shore wind energy installations in Spain, Germany, and Great Britain. Their locations in Germany, Spain and Great Britain are shown in Figure 2. Each of the triangle-shaped locations is chosen to represent an “average” plant for each of the countries concerning their yearly production patterns, i.e., it is neither a high nor a low-wind location. They are used for the Figure 3. For Germany two additional sites are chosen (rhombus-shaped icons) to test the efficacy of rent extraction for high and a low market value wind sites in Germany, used for Figure 4.
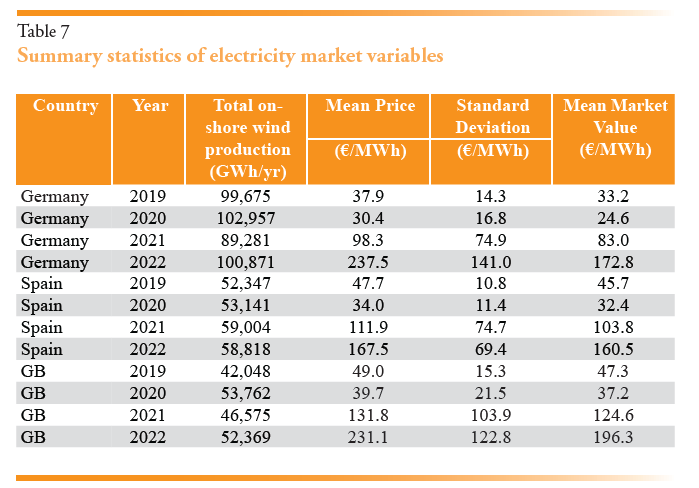
The summary statistics for the average market price and its standard deviation in each year and country, wind revenue/MWh, and MWh/MW are given in Appendix tables 6 and 7. German and GB prices are similar from 2019-2021 but considerably lower than Spanish prices, but in 2022 they are higher and differ considerably across countries. Capacity factors are also very different (shown in Appendix table 7) reflecting the different wind conditions at the locations, and that contributes to the differences in figure 3.
More detailed information on the data and modelling can be found in Appendices 1 and 2. The contract structures considered in the analysis are:
- No CfD, full market exposure.
- Two-sided CfD with hourly reference period paid on metered output.
- One-sided sliding premium with hourly reference period paid on metered output.
- Two-sided CfD with monthly reference period paid on metered output.
- Yardstick CfD paid on yardstick or reference output.
- Financial CfD paying an auction-determined fee/MW in exchange for market revenue of a reference plant.
All analysed, symmetric contracts are designed as a “fair hedge”, i.e., they pay each installation the mean revenue that they would have been paid when selling in the market over this period (thus the four-year averages are the same except for the one-sided sliding premium, SP). Thus, the most stable Financial CfD yields the same average revenue as selling at the market price for each installation, so comparing the two shows the effect of price volatility, while the cross-country comparisons show the combined effect of price and capacity factor differences.
6.3. Results
Figure 3 shows the effect of contract types on the yearly revenue of the installations over the years. It is apparent that all two-sided contracts have the effect of stabilizing the revenues between high and low-price years. Meanwhile, the one-sided sliding premium provides a floor for minimal revenues in low-price years but allows generators larger profits in the high-price years. Finally, the Financial CfD lowers the variance even more by taking out the remaining variance that is caused by varying production quantities between the years due to varying wind speeds (assuming that the plant can match the reference plant). Thus, all two-sided CfD schemes lead to a stabilization of generators revenues and, passed on, also of consumers’ electricity prices.
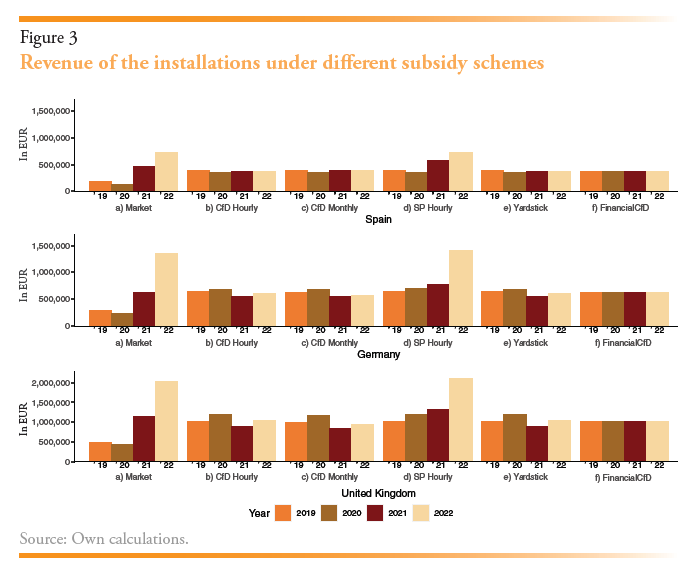
Figure 4 shows the Coefficient of Variation of generators’ monthly revenues. It shows the stability of the revenues for the contract schemes and allows us to infer the shares of the variability that can be attributed to price and production variability. All schemes reduce the variance of revenues as compared to selling the production on the market. As can be seen, the standard hourly CfD and Yardstick CfD have the same coefficient of variation as they eliminate the price risk but keep some remaining volume risk. In contrast, the monthly CfD maintains a small price risk that is caused by the deviations between the production profile of the installation and the average production profile of all installations. The higher “risk” in the sliding premium case is caused by the high revenues that can be earned in high price periods. The Financial CfD completely eliminates both price and volume risks.8
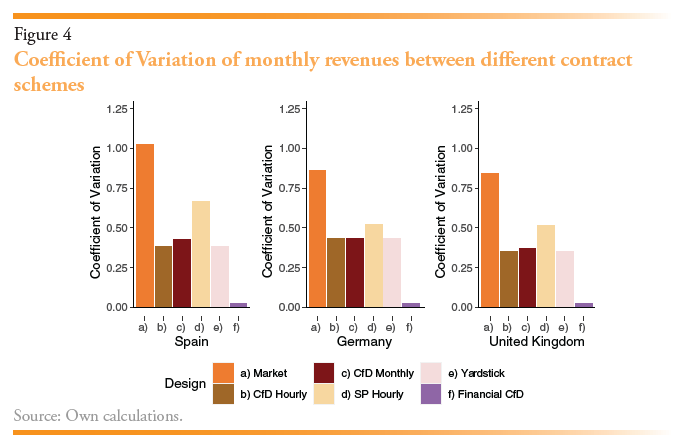
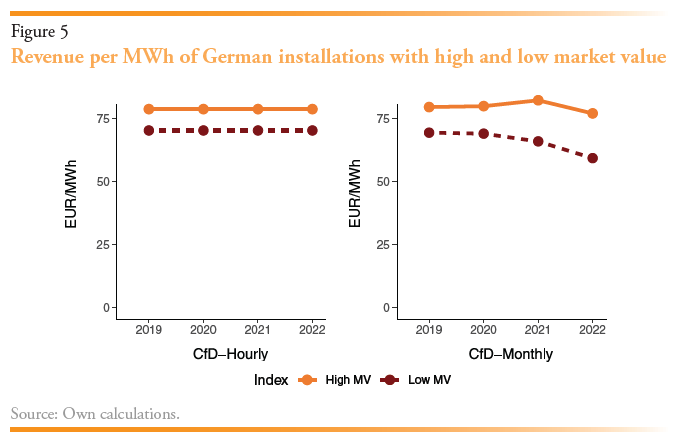
Figure 5 shows one of the investment incentives explained in the previous section. It shows the difference between the average prices captured by an installation at a high and a low wind location in Germany under an hourly and a monthly CfD scheme. It is apparent that under the monthly CfD scheme the installations can capture higher prices by producing when the overall production of renewable energy is low. Meanwhile, under the hourly CfD scheme both installations capture more similar prices. There is still a difference between the two since we designed the CfD price as a fair hedge for each installation, so that the high market value installation can already capture a slightly higher price per MWh.
7. CONCLUSIONS
The simulations for the monthly reference period show that each CfD design has its pros and cons, and that the choice of contract design requires careful consideration. With increasing price volatility during the energy crisis, the number of hours in which generators have incorrect incentives in the day-ahead markets increases. In 2019, none of the turbines considered failed to run the plant when spot market prices were positive. However, in 2022 this perverse response was observed for 20 percent of all hours for the German turbine of average production. For the Spanish turbine it was 4 percent, for the GB turbine 11 percent. Thus, additional rules are necessary to encourage production according to system needs in times of market turbulence.
This article has summarised the main types of current European contracts for Variable Renewable Electricity (VRE, wind and solar PV) to identify their shortcomings. In 2022, responding to these identified flaws, the European Commission required Member States to henceforward use two-sided Contracts-for-Difference (CfDs) to support VRE. We reviewed the design of such contracts in eight large European economies and tested their success in reducing risk using market price data and wind output for various locations in Germany, Spain, and Great Britain.
The design of VRE contracts should provide efficient operational incentives for producers to respond to day-ahead and balancing market price signals. They should minimise the cost to consumers while providing efficient investment incentives. Most importantly, the siting and technology choice of renewable energy investors should be guided towards system friendly investments, i.e., investments that minimise avoidable network congestion and minimise the need for fossil reserve power.
We find that there are examples that achieve some of these goals in one European country or the other, offering useful evidence that can be studied by their neighbours. This is even more the case when drawing on non-European evidence from Australia and the United States. In the numerical illustrations we show how different CfDs can reduce the revenue volatility of selected wind power projects in the three different countries. While one-sided CfD design provides a downside insurance for producers but allows them to make profits in prices of unexpectedly high prices at the expense of consumers, two-sided CfDs stabilize the revenue over time without that adverse impact. The remaining revenue variation is primarily caused by output risk which a Financial CfD largely eliminates. The choice of a longer period for calculating the reference price (monthly or daily rather than hourly) can provide some incentives for constructing renewable energy installations in areas that have a different production profile than the average turbine, but with some dispatch distortions.
Our review of contract designs show that the mandated two-sided CfDs usually pay on metered output, which distorts output decisions, but there are examples which attempt to mitigate this flaw. More recent proposals make payment contingent on reference power plants and, as with conventional financial CfDs for dispatchable plant, restore market price incentives for real-time dispatch. Most countries choose not to index the strike price, and this sits well with bond finance, which are mainly nominal, not real, financial instruments. Nominal contracts may have a higher initial strike price but by front-loading payments are likely preferable to investors, and their real cost declines with the expected continual fall in the real cost of VRE.
When it comes to minimising consumer cost and reducing excess VRE rent, contracts that support a given number of MWh/MW are preferable to those that apply for a fixed number of years. The German alternative of basing payment on resource quality has the effect of limiting rents and, depending on the strength of the adjustment, providing some incentives for investing in regions with lower full load hours – thereby spreading the installations more evenly across countries and perhaps locating closer to load centres and away from export-constrained distant locations.
However, additional policies will be needed to solve the main and most important remaining problem: to properly guide location choices, where no EU country has yet adopted Locational Marginal Pricing (LMP) and few make network usage charges vary with location. Locational charging and access rights need to be designed in harmony to achieve good locational and operating decisions as network congestion becomes increasingly important. Given the high ratio of peak to average VRE output, curtailment is an inevitable consequence of high VRE penetration. More to the point, the curtailment caused by the last MW of installed VRE will typically be 3+ times average curtailment, amplifying the cost of locating behind network constraints.
The signal to avoid locating where there are high marginal curtailment factors can be provided most simply by constraining off VRE in reverse order of entry – last in, first off – and not paying when constrained (thus only offering non-firm connection agreements at export-constrained locations). A similar effect can be provided by a combination of LMP and priority access to Congestion Revenue Contracts (also called Financial Transmission Rights, FTRs). Alternatively, the network owner can offer long-term use-of-system contracts at prices that reflect the efficient value of power injected at that location (given its time profile of output). This would in effect be the average difference between the system average price (the hub price) and the locational scarcity price behind the constraint. If LMP is introduced, the network owner could then offer hedging FTRs to the hub.
Overall, the article shows that there are often several ways to achieve desirable VRE contracts. One approach could be to combine a Yardstick-CfD, which yields efficient operational outcomes, with additional rules to incentivize efficient investment location, carefully choosing the right combination of instruments discussed above.
There remain important questions for further research. First, the multitude of European contract design options offers an opportunity for empirical research that tries to determine the effect of contract design on investment choices and market efficiency. Second, there is a need for further numerical simulations using longer time periods and increasing levels of VRE penetration. Thus, Green and Vasilakos (2012) simulated 12 years with high wind penetration allowing this to have an impact on hourly prices. Ideally the simulations would also model network constraints (Simshauser and Newbery, 2023) and export opportunities (Newbery, 2021). While the effects of “wrong” operational and investment incentives in a power system with moderate shares of renewable energy production might be modest, their importance will grow as VRE trebles over the next decade.
REFERENCES
Abrell, J., Rausch, S. and Streitberger, C. (2019). The economics of renewable energy support. Journal of Public Economics, 176, pp. 94–117.
Anatolitis, V., Azanbayev, A. and Fleck, A.-K. (2022). How to design efficient renewable energy auctions? Empirical insights from Europe. Energy Policy, 166, 112982.
Barquín, J., Rodilla, P., Cossent, R. and Batlle, C. (2017). Obtaining best value for money in res auctions: a capacity-based with an embedded menu of contracts approach. Working Paper IIT-17-177A. https://repositorio.comillas.edu/jspui/handle/11531/23913
CEER. (2015). CEER Status Review on RES Support Schemes, C14-SDE-44-03. https://www.ceer.eu/documents/104400/-/-/8b86f561-fa0b-0908-4a57-436bffceeb30
CEER. (2018). Status Review of Renewable Support Schemes in Europe for 2016 and 2017. Council of European Energy Regulators, C18-SD-63-03.
CEER. (2023). Status Review of Renewable Support Schemes in Europe for 2020 and 2021. Council of European Energy Regulators, C22-RES-80-04. https://www.ceer.eu/documents/104400/-/-/6c2376e9-7072-a1c1-0b8e-7b7954e17264
Congressional Research Service. (2013). European Union Wind and Solar Electricity Policies: Overview and Considerations, CRS 7-5700, R43176 at www.crs.gov
Eirgrid. (2022). Firm Access Methodology: Proposal, June, SEM22-068a at https://www.semcommittee.com/22-068-firm-access-methodology-ireland-eirgrid-proposed-methodology
Fabra, N. and Fabra, I. (2023). Market Power and Price Exposure: Learning from Changes in Renewable Energy Regulation. American Economic Journal: Economic Policy, 15(4), pp. 323-358. https://doi.org/10.1257/pol.20210221
FTI. (2023). Assessment of locational wholesale electricity market design options in GB, at https://www.ofgem.gov.uk/sites/default/files/2023-10/FINAL%20FTI%20Assessment%20of%20locational%20wholesale%20electricity%20market%20design%20options%20-%2027%20Oct%202023%205.pdf
Green, R. and Vasilakos, N. (2010). Market Behaviour with Large Amounts of Intermittent Generation. Energy Policy, 38(7), pp. 3211–3220. doi:10.1016/j.enpol.2009.07.038.
HMG. (2022). Review of Electricity Market Arrangements consultation at https://www.gov.uk/government/consultations/review-of-electricity-market-arrangements
HoC. (2013). Energy Act 2013, 2013.c.32, at http://www.legislation.gov.uk/ukpga/2013/32/contents/enacted/data.htm HMG, 2022
Huntington, S., Rodilla, P., Herrero, I. and Batlle, C. (2017). Revisiting support policies for RES-E adulthood: Towards market compatible schemes. Energy Policy, 104, pp. 474-483. http://dx.doi.org/10.1016/j.enpol.2017.01.006
Kröger, M., Neuhoff, K. and Richstein, J. C. 2022, Discriminatory Auction Design for Renewable Energy: The Economics of the German Reference Yield Model, at https://papers.ssrn.com/sol3/papers.cfm?abstract_id=4291671
Kröger, M. and Newbery, D. (2024). Designing efficient long-term renewable electricity contracts. EPRG WP (forthcoming).
Meeus, J., De Vits, S., S’heeren, N., Delarue, E. and Proost, S. (2021). Renewable electricity support in perfect markets: Economic incentives under diverse subsidy instruments. Energy Economics, 94, 105066, pp. 1-18, at https://doi.org/10.1016/j.eneco.2020.105066
Mendes, C., Staffell, I. and Green, R. (2023). Euromod: Modelling European Power Markets with Improved Price Granularity, at http://dx.doi.org/10.2139/ssrn.4523084
Neuhoff, K., et al. (2023). Contracting Matters: Hedging Producers and Consumers with a renewable energy pool, at https://papers.ssrn.com/sol3/papers.cfm?abstract_id=4391536
Newbery, D. (2021). National Energy and Climate Plans for the island of Ireland: wind curtailment, interconnectors and storage. Energy Policy, 158, 112513, pp. 1-11. https://doi.org/10.1016/j.enpol.2021.112513
Newbery, D. (2022). Response to Review of Electricity Market Arrangements, at https://www.eprg.group.cam.ac.uk/wp-content/uploads/2022/10/Newbery-Response-to-REMA-.pdf
Newbery, D. (2023). Designing efficient Renewable Electricity Support Schemes. The Energy Journal, Vol. 44(3), pp. 1-22. https://doi.org/10.5547/01956574.44.3.dnew
Ragwitz, M. and Steinhilber, S. (2014). Effectiveness and efficiency of support schemes for electricity from renewable energy sources. WIREs Energy Environ, 3, pp. 213–229. https://doi.org/10.1002/wene.85
Roques, F. A., Newbery, D. M. and Nuttall, W. J. (2008). Fuel mix diversification incentives in liberalized electricity markets: a Mean-Variance Portfolio Theory Approach. Energy Economics, Vol 30(4), pp. 1831-1849. https://doi.org/10.1016/j.eneco.2007.11.008
Roques, F. A., Nuttall, W. J., Newbery, D. M., de Neufville, R. and Connors, S. (2006). Nuclear Power: a Hedge against Uncertain Gas and Carbon Prices? The Energy Journal, 27(4), pp. 1-24. http://www.iaee.org/en/publications/ejarticle.aspx?id=2155
Schlecht, I., Hirth, L. and Maurer, C. (2023). Financial Wind CfDs, at https://econpapers.repec.org/paper/zbwesprep/267597.htm
Scott, D. and Morawiecka, M. (2023). The search for two-sided CfD design efficiency – a Shakespearean history. https://blueprint.raponline.org/deep-dive/cfd-part-ii/
Simshauser, P. and Newbery, D. (2023). Non-Firm vs. Priority Access: on the Long Run Average and Marginal Cost of Renewables in Australia. https://www.eprg.group.cam.ac.uk/eprg-working-paper-2322/
NOTES
♦ We are indebted to the editor for helpful comments.
* DIW Berlin and Technical University Berlin.
** EPRG, University of Cambridge.
1 https://unfccc.int/process-and-meetings/the-paris-agreement
2 https://ec.europa.eu/commission/presscorner/detail/en/qanda_23_1593
3 These calculations have been made using individual wind farm annual outputs provided by the Renewable Energy Foundation at https://www.ref.org.uk
4 Capacity contracts are suitable for existing nuclear plant where the only question is whether the auction price is sufficient to cover their fixed costs or whether it is time to retire the plant (assuming the auction price is set by plant paying the correct carbon price).
5 See https://english.rvo.nl/en/subsidies-financing/sde/features
6 This is based on the empirical evidence and the more detailed analysis provided in Kröger and Newbery (2024, forthcoming).
7 In the absence of nodal pricing prh = ph.
8 The remaining variation in the figure is caused by differing number of days between the months.
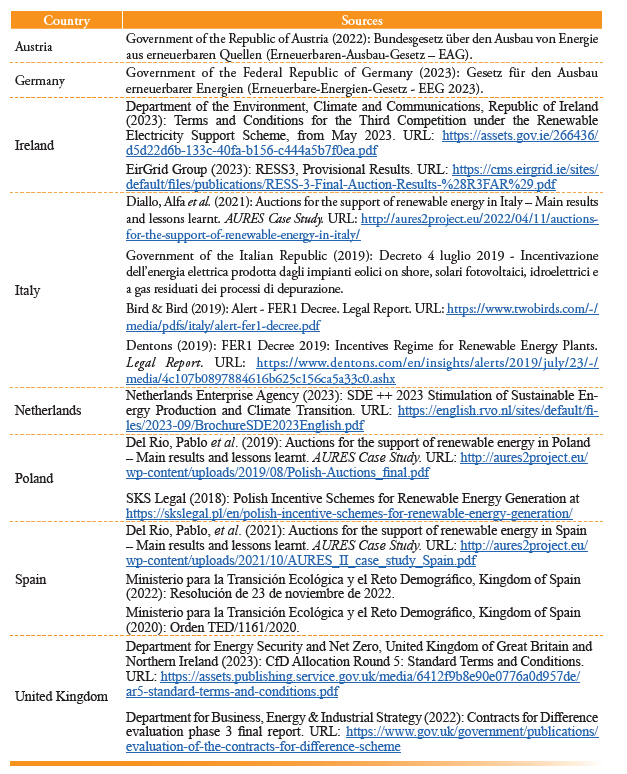
APPENDIX 1. LEGISLATION AND REPORTS CONSIDERED FOR TABLES 1-6
APPENDIX 2. DATA SOURCES
The data used for the numerical illustration comes from three different sources. First, wind data was collected from the ERA-5 reanalysis data that is available from the Climate Data Store (https://cds.climate.copernicus.eu/). For each location used in the analysis we collect the wind speed at 100m. Second, the power curve of a reference turbine is collected from the data available as part of the Renewable Ninja package. Third, data on power prices and on-shore wind production is collected from the ENTSO-E Transparency platform for Spain and Germany. For the United Kingdom, the data on forecasted wind production is collected from the system operator National Grid is collected (https://www.nationalgrideso.com/data-portal/day-ahead-wind-forecast). The price data has been collected for a previous research project. Revenues from the United Kingdom are transferred into Euros with the average exchange rate in 2022 (1 GBP = 1.17 EUR).
Table 7 shows the summary statistics of the average on-shore wind production, the sum of total on-shore wind production, the average electricity price, the variance of the electricity price and the “market value” wind energy in each of the countries. We define the market value as the mean of the market prices weighted by the production of on-shore wind, while the mean price is the unweighted mean price. Table 8 shows the mean wind speed at 100 m, the variance of the wind speed at each location, and the sum of total wind production for each of the locations considered for the analysis.
1. Model
The numerical illustration proceeds as follows. First, we correct the wind speeds. In order to do this, we calculate the wind speed at the hub height of the installed turbine as:

This is the formula used in the German reference yield model and allows us to scale the wind speeds at 100 m (v100) to the speed at the height of the turbine at x m (vx). In the case of the Enercon E-115 the hub height is 135 m. Second, we calculate the production at each location. To calculate the production at each hour we match the wind speed in each hour with the power curve of the Enercon E-115 turbine, which has been one of the most commonly built turbines in Germany in recent years, in order to calculate the production of the project in this hour. Finally, we calculate the revenue under the different support schemes.
This simplified approach is based on a number of assumptions. First, we assume that at all locations the same turbine is built, i.e., that there is no effect of technology-choice on the revenues of the projects. In reality, some support schemes such as the longer reference period would incentivize the building of different types of turbines. Second, we assume that the entire production is sold on the day ahead market and that there are no imbalances. In reality, wind on-shore producers might trade part of their production on the forward or intraday market as well. Third, in the UK case we assume, for the lack of better data, that the forecasted wind production equals the actual production on the following day. Fourth, the number of full load hours will be higher than those achieved in real life, since we abstract from curtailment as well as the unavailability due to maintenance.