

How could the ECB exit QE?
Fecha: enero 2021
Miguel Carrión Álvarez, Funcas Europe
In December 2020, the ECB decided to continue its regular Asset Purchase Programme and the Pandemic Emergency Purchase Programme for at least another year. By the end of 2021, the ECB may have accumulated close to 5 trillion euros worth of bonds on its balance sheet. Eventually, however, asset purchases will stop on a net basis. Then the question of an exit strategy from quantitative easing (QE) will arise.
How long can one expect the ECB to continue buying bonds?
The stated goal of the ECB’s asset purchase programmes is to bring inflation durably to its target (1). This is the combination of two commitments: to keep interest rates at least as low as they are now until inflation converges to the 2% target within the ECB’s projection horizon, and to continue net asset purchases until it is ready to start raising rates again. Given the ECB’s own expectations, it is unlikely that this will happen before 2023.
The central bank has not been too successful in raising inflation back to its target. Core inflation not only has remained stubbornly low since before asset purchases started in earnest in 2015 but, after the summer of 2020, it has dropped to new historical lows (2). This is seen in Figure 1.
Figure 1: harmonised eurozone inflation, headline and core (source: Eurostat)
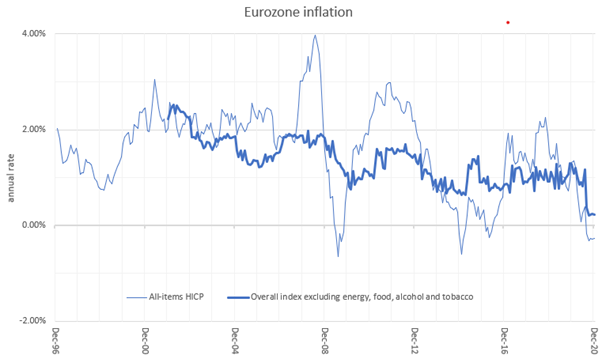
Core inflation is foreseen by the ECB to remain as low as 1.2% at the end of 2023 (3).
One plausible reason for the failure of eurozone core inflation to recover, even under substantial central bank asset purchases, is that the monetary union is in what Richard Koo has called a balance-sheet recession (4).
Simply put, a balance-sheet recession is a situation in which, after a collapse in asset prices, the private sector finds itself effectively insolvent and shifts its behaviour from maximising profit to minimising debt. As a result, investment and consumption are reduced, leading to recession. But the characteristic feature of a balance-sheet recession is a collapse in the demand for credit. This means monetary policy intended to support credit is ineffective in a balance-sheet recession, because credit becomes demand-constrained and not supply-constrained.
We can see evidence for an enduring eurozone balance-sheet recession in ECB credit data (5). Figure 2 shows total credit to the private non-financial sector, in the form of both loans and securities, by the financial sector including the Eurosystem. The reason for including it is that, when a central bank buys private-sector bonds from investors, it still counts as financing that needs to be taken into account. The grey line in the chart is Eurosystem credit to the public sector, which is mostly just bond purchases as central banks in the EU do not lend to governments directly. The Public Sector Purchase Programme is clearly visible starting in March 2015, and the Pandemic Emergency Purchase Programme in April 2020.
Figure 2: ECB QE and eurozone balance-sheet recession (source: ECB)
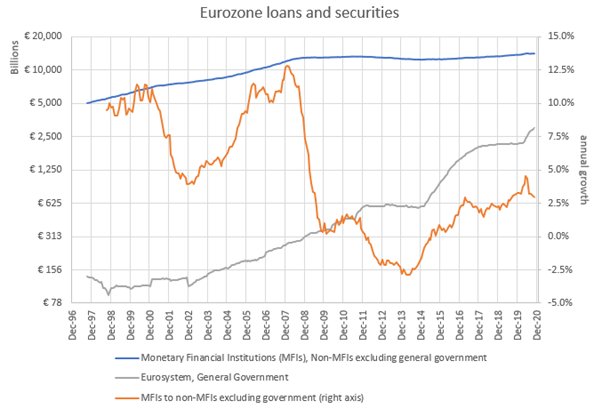
What we can see in figure 2 is that, in brisk times, total credit to the eurozone’s non-financial private sector can grow at an annual rate of above 10%. In 2001-2004 the eurozone experienced an economic slowdown that did not quite constitute a recession. Even then, total credit to the non-financial private sector was growing at more than 5% per year. But, after 2008, the global financial crisis caused annual credit growth to drop below 2.5%, where it remained until 2019. After 2011, the eurozone crisis led credit growth to turn negative until 2015. Even now, credit growth remains below the lowest rate seen prior to the global financial crisis, and below the nominal GDP growth rate.
The Covid-19 crisis is only going to make the situation worse. The drop in incomes and profits due to the pandemic means private debt after the crisis will be higher relative to GDP than it used to be before it. If before the pandemic the private sector was already reluctant to take on debt, it is likely to be even more so afterwards.
Does the ECB face a taper tantrum?
The difficulty in exiting QE is illustrated by the so-called taper tantrum. This refers to strong movements in bond and currency markets in the summer of 2013 in response to Fed communications on the likely tapering, that is reduction and later unwinding, of its QE programme (6). The first such episode was triggered by the mere suggestion from Ben Bernanke, then chairman of the US Federal Reserve, that the pace of asset purchases might be reduced later in the year. This caused an immediately fall in the price of US treasury bonds by approximately 1%, and a similar rise in the US dollar’s exchange rate.
The taper tantrums happened because market participants anticipated the effect of tighter US monetary policy on bond and currency markets. A reduced pace of asset purchases, let alone a shift to net sales, could be expected to raise bond yields and the value of the dollar. Market participants anticipated these effects, leading to a bond sell-off. The issue is that such market anticipation makes it harder for the central bank to follow through with pre-announced tapering plans, because the intended effect on bond markets has already happened.
The ECB may face a similar situation if and when it decides to unwind its asset purchases. This includes a risk of national fragmentation. It is possible that the various national bond markets in the eurozone will react differently to the prospect of the ECB selling off its bond holdings. The ECB holds a disproportionate amount of French and especially Italian and Spanish bonds, relative to, say, German or Dutch bonds. Thus, when the ECB starts selling from its QE holdings one may expect a widening of cross-country bond spreads in the eurozone. In fact, if the Fed’s taper tantrum is any guide, this market reaction may take place before the ECB even starts unwinding its position. This would make market conditions unfavourable for the ECB carrying through the unwinding. The ECB has been here before. It started reducing the pace of its asset purchases in 2017, and in 2019 asset purchases stopped altogether (7). However, when this tapering and eventual stop of net asset purchases was pre-announced by Mario Draghi, no ill effects were evident in the euro government bond or exchange rate markets (8).
However, it is a legitimate question whether in the future the ECB will be able to use forward guidance so effectively as it did under Mario Draghi to avoid a taper tantrum.
A possible way out of QE
There is one way in which the ECB could use net asset sales to stabilise bond markets, however, and that is to compensate for a reduction in net issuance of debt by eurozone governments. At present, net debt issuance by eurozone governments is near the highs reached in the Great Recession that followed the Global Financial Crisis. But government deficits, and with them net government debt issuance, are expected to taper off in the next couple of years. Once GDP reaches pre-pandemic levels but probably not before, the European Union will stop applying the general escape clause from the Stability and Growth Pact. This will require a reduction of debt ratios, if not negative debt issuance on the part of member states.
Negative net debt issuance by government reduces the supply of government bonds in the financial markets, tending to put upward pressure on bond prices, and so downward pressure on yields. This may not be consistent with ECB monetary policy objectives, especially if inflation returns. In that case, the ECB may wish for a higher general level of interest rates, including government bond yields. One way to achieve this might be for the ECB to sell bonds out of its APP and PEPP holdings (7) (9).
The amounts involved are likely to be relatively small, however. To illustrate this, consider the historical fluctuations in net issuance of government bonds and the size of the ECB asset purchase programmes. These are shown in Figure 3.
In major economic downturns such as the Great Recession or the Covid-19 crisis, net government bond issuance may reach up to a trillion euros a year (10). It was just under €800bn at its previous peak in 2009, and will be higher than that in 2020. The volume of ECB government bond purchases under the APP peaked just above €800bn a year in 2017, and it will likely come close to a trillion euros at its peak in 2021.
In normal times, eurozone net government bond issuance oscillates between €100bn and €200bn a year. The impact of the PEPP has been to stabilise the net supply of government bonds in 2020 at about €100bn a year, at least to judge by the first four months of the programme which is the period covered by available data on eurozone government bond issuance.
Figure 3: lagging 12-month net supply of government bonds (sources: Eurostat and ECB)
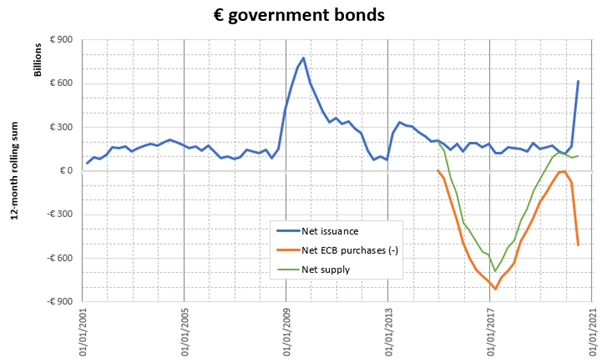
Figure 3 shows the 12-month running net government bond issuance, computed from Eurostat quarterly data on government debt outstanding. It is compared with the cumulative ECB government bond purchases, which is available monthly for the APP and its PSPP component and on a bimonthly basis for the PEPP. The chart shows the sum of the PSPP and PEPP. It also shows the net supply of eurozone government bonds, which is the difference between net government bond issuance and net ECB public sector bond purchases.
One thing the ECB could to is committing to stabilise net eurozone government bond supply at €200bn a year after the debt brake comes back into effect. This might require less than €100bn a year in net asset sales by the ECB. Higher target amounts of net bond supply would lead to correspondingly higher government bond yields. Because of the size of its bond holdings, the ECB could sustain such a policy as a way to unwind QE over many years.
References
1. European Central Bank. Monetary policy decisions. Media. [Online] 10 December 2020. https://www.ecb.europa.eu/press/pr/date/2020/html/ecb.mp201210~8c2778b843.en.html.
2. Eurostat. Euro area annual inflation stable at -0.3%. News. [Online] 7 January 2021. https://ec.europa.eu/eurostat/documents/portlet_file_entry/2995521/2-07012021-AP-EN.pdf/2b31a77f-a4a9-8b39-44f9-20b256dceb03.
3. European Central Bank. Eurosystem staff macroeconomic projections for the euro area. Research and Publications. [Online] 10 December 2020. https://www.ecb.europa.eu/pub/projections/html/ecb.projections202012_eurosystemstaff~bf8254a10a.en.html.
4. Koo, Richard. Balance sheet recession is the reason for ‘secular stagnation’. VoxEU. [Online] 11 August 2014. https://voxeu.org/article/balance-sheet-recession-reason-secular-stagnation.
5. European Central Bank. Balance Sheet Items. Statistical Data Warehouse. [Online] 29 December 2020. https://sdw.ecb.europa.eu/browse.do?node=1491.
6. Neely, Christopher J. Lessons from the Taper Tantrum. St. Louis Fed economic research. [Online] 28 January 2014. https://research.stlouisfed.org/publications/economic-synopses/2014/01/28/lessons-from-the-taper-tantrum/.
7. European Central Bank. Asset purchase programmes. Monetary Policy. [Online] January 2021. https://www.ecb.europa.eu/mopo/implement/app/html/index.en.html.
8. Ashworth, Marcus. Taper Tantrum? Avoided. We’ll Miss You, Mario Draghi. Bloomberg. [Online] 13 December 2018. https://www.bloomberg.com/opinion/articles/2018-12-13/taper-tantrum-avoided-we-ll-miss-you-mario-draghi.
9. European Central Bank. Pandemic emergency purchase programme (PEPP). Monetary Policy. [Online] January 2021. https://www.ecb.europa.eu/mopo/implement/pepp/html/index.en.html.
10. Eurostat. Government finance statistics – quarterly data. Statistics Explained. [Online] 22 October 2020. https://ec.europa.eu/eurostat/statistics-explained/index.php/Government_finance_statistics_-_quarterly_data.