Fecha: abril 2024
Vicente Salas Fumás*
Abstract
Capital investment in the Spanish non-financial corporate sector has yet to return to pre-pandemic levels, and its recovery lags behind that of corporate output and employment, as well as compared to investment trends in other sectors of the economy. This report examines and evaluates several interconnected explanations for the observed behavior of aggregate corporate investment in Spain during the period 2019-2023: the positive output gap (excess capacity effect), the increase in the relative price of capital services compared to labor services (input substitution effect), and the corporate rate of return on operating capital stock remaining below pre-pandemic levels (incentives effect). The results of the analysis indicate that excess capacity, which affects the evolution of the return on capital stock, and the capital input becoming more expensive than labor can explain the evolution of capital investment. There is no evidence that financial constraints could have influenced investment decisions, although the mix between internal generated funds and bank debt could have changed particularly among large firms, with more internal and less external finance. There are positive signs that corporate investment will recover in 2024 (positive incentives to invest in 2023), but they may not be sufficient to motivate pre pandemic investment rates. The situation could be worst if the decrease in profit margin and rate of return observed during the second half of 2023 continues.
1. INTRODUCCIÓN
Capital investment stands as a pivotal determinant of production capacity, output, and productivity growth. As of 2023, the aggregate fixed capital investment within the Spanish non-financial corporate sector has yet to rebound to pre-pandemic levels, trailing behind the recovery observed in aggregate output and employment. This report describes and examines the trajectory of non-financial corporate investment in Spain from 2019 to 2023, assessing it through various economic theories about firms’ investment behavior. The study period encompasses 2019, the pre-pandemic year, the pandemic years of 2020 and 2021, and the post-pandemic recovery period marked by the Ukrainian war shock and its ensuing consequences, including the inflationary episode spanning 2022 and 2023.
Analysis reveals that non-financial corporations (NFCs) have sustained their capital stock at pre-pandemic levels throughout the 2019-2023 period, while labor quantity has fluctuated in response to production requirements. Assuming total factor productivity levels akin to those of 2019, the estimated production capacity, given the available capital and labor by the end of 2023, still surpasses actual production levels. In essence, from the onset of the pandemic until the end of 2023, the corporate sector has operated with considerable excess capacity. Moreover, the user cost of capital has outpaced the cost of labor over the study period, incentivizing firms to favor labor-intensive production methods over capital-intensive ones. The evolution of excess capacity emerges as the primary explanatory factor for fluctuations in the average rate of return on capital during the period. Although the rate of return surpasses the cost of capital during the year 2023 –following several quarters where costs exceeded returns– the surplus is lower than pre-pandemic levels. With the output gap nearly nonexistent by the end of 2023, future investment prospects hinge on factors mirroring those of the recent past: the trajectory of relative input prices and the attainment of a rate of return on capital sufficient to offset input costs.
Various analysts have voiced concerns over the sluggish recovery of capital investment in Spain, offering diverse explanations. Domenech and Sicilia (2024) attribute the subpar performance of capital investment in Spain –across the board, not solely within the corporate sphere– to heightened fiscal pressure and the deterioration of public sector institutional quality. Torres (2023) points to Spanish corporations’ manifested preference for deleveraging over investment expansion. Hernández de Cos (2024), Governor of Banco de España, warns of the adverse impact of escalating uncertainty surrounding government policies in Spain on capital investment decisions by entrepreneurs and managers. While our theoretical framework accommodates heightened uncertainty by incorporating elevated risk premiums and increased cost of capital, thereby dampening investment incentives for a given rate of return, it also furnishes alternative, theory-grounded economic rationales. These include the trajectory of relative input prices, the adequacy of capital investment in maintaining production capacity even during output downturns, and the absence of robust incentives for investment owing to the failure of the rate of return on the capital stock to regain pre-pandemic levels.
Aguilar et al. (2023) model and econometrically estimate the evolution of aggregate capital investment for the Spanish economy (excluding construction) as contingent upon interest rates, aggregate demand, and business confidence during the pandemic and subsequent recovery period (until the first semester of 2022). As anticipated, they discern a negative, albeit delayed, response of capital investment to interest rate hikes, juxtaposed with a positive correlation with output and confidence upswings. Our study diverges in several respects: we utilize aggregate corporate sector data rather than individual firm data and extend theoretical explanations of observed corporate investment to encompass a broader spectrum of economic theories, including neoclassical, accelerator, and Tobin’s q theories.
The remainder of this report comprises three main sections. The first delineates the evolution of gross and net capital investment within the Spanish corporate sector throughout the study period, contrasting it with output trends and investment patterns across other institutional sectors and countries. The second segment succinctly expounds on economic theories elucidating firms’ capital investment decisions, particularly demand-pull (accelerator) and supply-push (Tobin’s q) explanations. Lastly, the third segment scrutinizes the extent to which investment data aligns with the various theoretical frameworks. The concluding section encapsulates key findings and forward-looking insights regarding the immediate future of corporate capital investment in Spain.
2. CORPORATE FIXED CAPITAL FORMATION IN SPAIN: A COMPARATIVE ANALYSIS
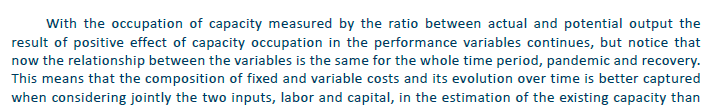
The initial descriptive analysis juxtaposes the trajectory of output and capital formation within the Spanish non-financial corporate sector (NFC) over a five-year period spanning from 2019 to 2023, as depicted in Figure 1. Output, denoted by the gross value added (GVA) of the non-financial corporate sector, is assessed at constant prices, adjusted by the GDP deflator of the economy recalculated to exclude the implicit deflator of financial services (refer to Appendix 1 for elucidation). Concurrently, capital formation is gauged through the gross fixed capital formation (GFCF), also evaluated at constant prices, utilizing the GFCF price deflator of the Spanish economy as the pertinent price index1.
In 2019, prior to the onset of the pandemic, and throughout the pandemic period, the normalized values of GFCF and output-GVA within the Spanish non-financial corporate sector exhibited a significant overlap. In 2019, both variables displayed an upward trajectory in real terms, with output increasing at an average annual rate of 2.2% and GFCF at an annual rate aroud 4.5%. However, the advent of the COVID-19 pandemic precipitated a shift from positive to negative trends, resulting in concurrent declines in output and capital investment until the second quarter of 2021. During this period, the annualized real flows of both variables were 12% lower than their respective pre-pandemic values recorded in 2019. From the third quarter of 2021 onward, corporate output embarked on a gradual recovery trajectory. By the end of 2023, the GVA of the non-financial corporate sector had surpassed its pre-pandemic level of 2019 by 4.1% in real terms. Conversely, GFCF maintained a downward trajectory throughout 2022, persisting at levels approximately 85% of those observed during the pre-pandemic period until the conclusion of 2023.
The subsequent analysis delves into a comparative assessment of capital investment within the Spanish non-financial corporate sector against that of a select group of European countries, including Germany, France, Italy, Sweden, and Spain, as depicted in Figure 2. The pre pandemic ratio of GFCF over GVA of the Spanish non-financial corporate sector is among the highest across the corporate sectors of the countries compared, and 30% higher than the German one. Spain is the only country compared where the ratio of GFCF over GVA has been decreasing since 2020 to a value that in 2023 is 4 percentage points lower than in 2019.
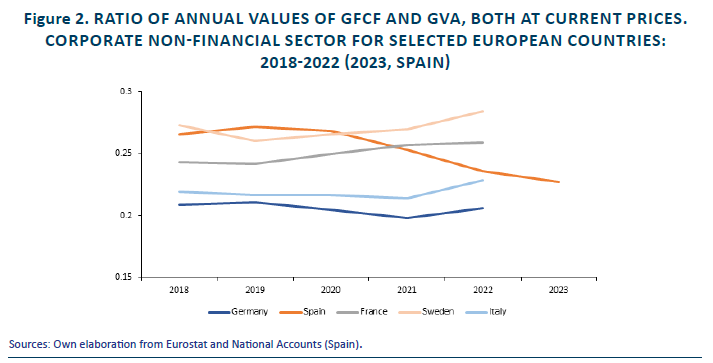
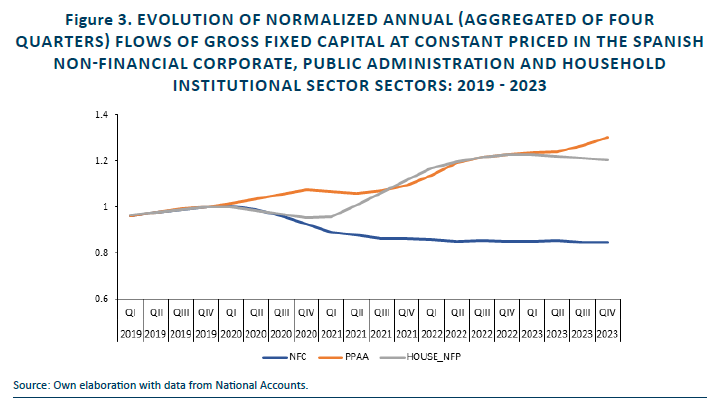
Figure 3 compares the gross capital investment of the non-financial corporate sector with the capital investment of other institutional sectors of the Spanish economy, namely the Public Administrations, PPAA, and the Household-Not for Profit, HOUSE_NFP sectors. Similarly, Figure 4 shows the comparative evolution of net fixed capital investment flows (gross minus capital consumption).
In the pre-pandemic year of 2019, GFCF across the three institutional sectors exhibited parallel growth rates, hovering around 4% annually in real terms (Figure 3). However, during the pandemic, GFCF declined in the non-financial corporate and household-NFP sectors, while experiencing an uptick in the public administration sector, consistent with activism of government interventions during the crisis episode. This trend persisted into 2020, but in 2021, capital formation in the household and not-for-profit sector rebounded, contrasting with continued declines in the non-financial corporate sector2. By 2023, GFCF in the PPAA and HOUSE_NFP sectors had surged by 30.4% and 20.4% respectively compared to 2019, whereas GFCF in the NFC sector had plummeted by 15%.
The evolution of net fixed capital formation over the same period underscores the divergence in capital accumulation dynamics between the corporate sector and other institutional sectors during the recovery period (Figure 4). As capital consumption escalated over time while gross capital flows dwindled, the decline in net fixed capital formation within the corporate sector surpassed that of gross capital formation. Remarkably, by 2023, net capital formation in the non-financial corporate sector had dwindled to a mere 8% of its 2019 level. Essentially, during the recovery phase, the aggregate gross fixed capital investment in the corporate sector barely sufficed to offset capital consumption from the existing stock.
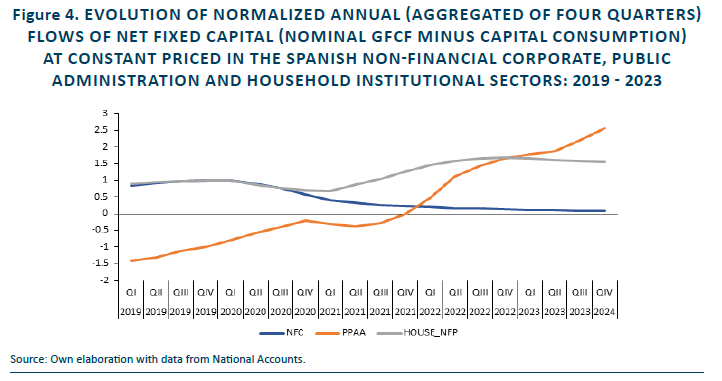
Figure 4 also highlights the persistent negative net capital formation in the public administration sector until 2021, indicative of annual flows of gross fixed capital trailing behind capital consumption. However, from 2022 onwards, net capital formation in the public administration sector reversed course, accelerating positively. While the Next Generation EU (NGEU) programs likely contribute to the accumulation of public capital, their impact on business capital formation remains imperceptible at present.
2.1. Capital stock of NFC
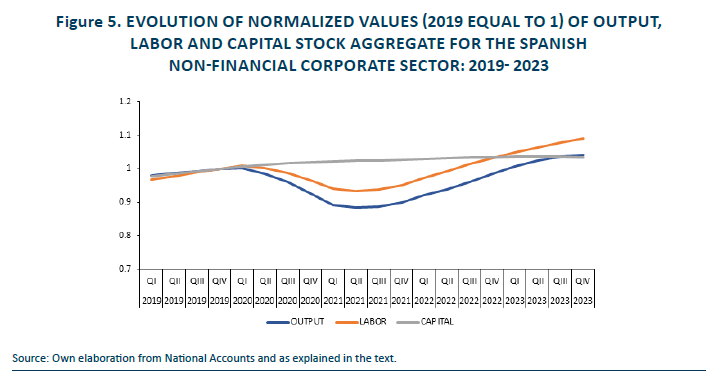
The capital stock of capital services of firms in a moment in time is the result of new flows of capital investment and the consumption in production or by obsolescence of capital stock accumulated in the past. Figure 5 shows the evolution of the normalized capital stock aggregate for the Spanish NFC sector during the period 2019-2023, normalized for the value of 2019. For comparative reasons the Figure also shows the evolution of normalized values of output and labor.
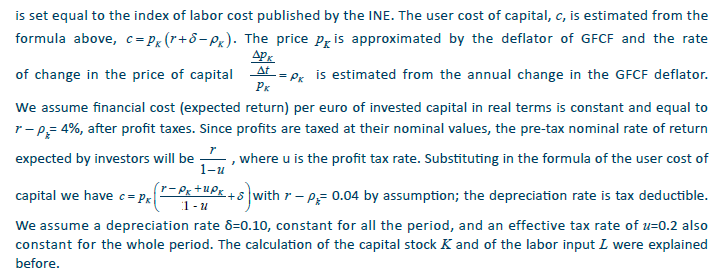
The normalized output flow is the same as in Figure 1. The labor input is measured by the annualized compensation of employees of NFC from national accounts, deflated by the cost of labor index for the Spanish economy published by the INE. The capital stock is calculated through the permanent inventory method: The stock of capital at the end of period t-1 is valued at current replacement cost using the GFCF deflator of the Spanish economy; the capital stock at the end of period t is equal to the capital stock at t-1 plus the flow of fixed capital formation in period t at current prices and minus the consumption of capital during period t. The stock of capital at current replacement cost values is then deflated at constant prices of the reference year using as price index the GFCF deflator.
In 2019, prior to the pandemic, the evolution of output, labor, and capital inputs exhibited synchronous upward trends. However, the dynamics shifted with the onset of the pandemic. Output transitioned from growth to decline at the pandemic’s outset (first quarter of 2020), followed by a decline in labor input one quarter later. The capital stock continued to grow, albeit at more moderate rates than pre-pandemic levels, until the second quarter of 2021. Both output and labor input declined throughout 2020, reaching a nadir in the second quarter of 2021. The decline in output was more pronounced, falling to 88% of its pre-pandemic peak, compared to the labor input’s decline to 94.5% of its pre-pandemic value. From the second quarter of 2021 onward, both output and labor inputs have exhibited steady growth. By 2023, the estimated output of the non-financial corporate sector surpassed its pre-pandemic 2019 level by 4.1%, while the labor input increased even further, reaching 8.9% above its 2019 level. The estimated capital stock experienced moderate growth during the pandemic, likely due to inertia in executing previously approved investment projects, and has remained relatively stable throughout most of the period. In 2023, the relationship between capital and output resembles that of 2019, but the significant increase in labor input implies a lower ratio of capital stock per unit of labor in 2023 compared to 2019.
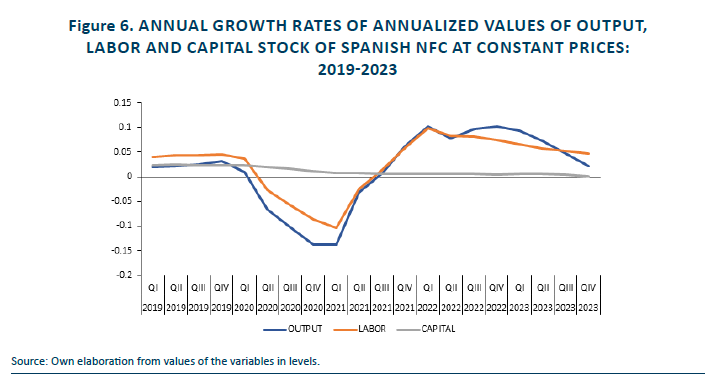
Figure 6 illustrates the annual growth rates of the annualized values of output and inputs, derived from the level values depicted in Figure 5. The volatility of the growth rate in NFC output surpasses that of the rate of changes in input quantities, mirroring the patterns observed in the level values. This observation suggests the presence of a fixed component in input quantities that remains unaffected by output variability, pointing out to fluctuations in input utilization rates over the economic cycle. Furthermore, the annual growth rates of output and labor input exhibit a closer resemblance than those of the capital stock, implying that variations in the utilization rates of capital have been more pronounced than those of labor. In line with the trend depicted in Figure 5, the rate of change in capital stock has progressively declined over the period, transitioning from annual growth rates of 2.5% in the pre-COVID year of 2019 to virtually zero growth throughout 2022 and 2023. Overall, the evolution of the capital stock during this period reflects an investment policy aimed at maintaining a constant capital stock through a gross capital investment flow equal to capital consumption.
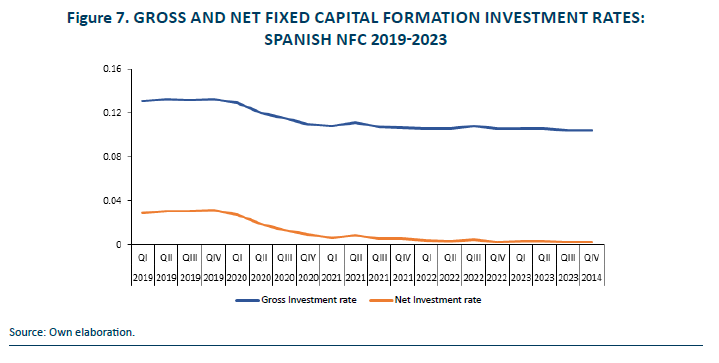
The descriptive information on the evolution of capital formation in the Spanish non-financial corporate sector is completed with the capital investment rates, gross and net, calculated by the ratio of the annualized flow of capital investment over the capital stock lagged one year, all values at constant prices (Figure 7). The investment rates in terms of gross and net fixed capital formation were around 13% and 3%, respectively, in the pre pandemic year of 2019. During the pandemic period both rates gradually decreased to values around 10.5% and 0.5%, respectively, that have remained practically unchanged during the period from 2021 to 2023. Notice that the comparison between gross and net fixed capital investment rates suggests a depreciation rate from capital consumption for NFC sector of around 10% of the existing capital stock.
3. THE ECONOMIC THEORY OF BUSINESS CAPITAL INVESTMENT
This section provides a summary of various economic theories proposed to elucidate capital investment by private firms. These theories begin with the optimization problem faced by firms, aiming to determine the allocation of production output and inputs over time to maximize the present value of current and future cash flows in a forward-looking manner3. The inputs considered are labor and capital, where labor is regarded as a flow and the capital stock internally provides services utilized in production alongside labor. The capital stock undergoes depreciation at a specified rate, but new capital is incrementally added over time through fixed capital investment. Consequently, the capital stock at the end of period t equals the initial capital stock minus the capital consumed in production (depreciation) plus the new investment flow in period.
Given that capital services for production are internally provided by firms from the capital stock, the cost of capital per unit of service internally supplied is implicitly determined (referred to as shadow price) from the optimization problem. Conversely, output and labor are valued at their respective market prices. A pivotal variable in explaining capital stock and investment is the shadow price or user cost of capital services for the maximizing firm’s present value of current and future cash flows (Jorgenson, 1963):
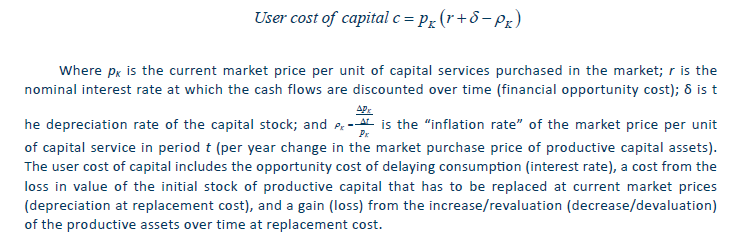
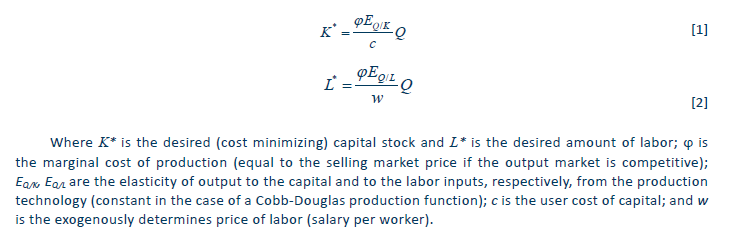
The dynamic optimization problem can be simplified into an equivalent period by period profit maximization problem with the user cost of capital as shadow price of one unit of capital service internally supplied by the firm for production jointly with labor. For example, a firm with a known production technology wants to produce a volume of output per period Q with two inputs, capital, K, and labor, L, in a cost minimizing way. From the first order conditions of optimal, the quantities of capital and labor used in production should be those solving the equations:
The capital investment flow is set equal to the change in capital stock, I=∆K. The more straightforward theory of investment (the accelerator theory) assumes that changes in capital stock are directly determined by changes in the output
Equation [3] can be generalized assuming that firms face adjustment costs so that the transition from the current to the desired capital stock in response to changes in the exogenous output is done gradually. Then,

Dividing by the lagged capital stock,

The investment rate will now be proportional to the ratio between the exogenously given output and the current capital stock, with a proportionality factor that depends on the cost and technology parameter, a, and on the adjustment parameter, λ.
The assumption of proportionality between output and capital stock and between capital investment flow and changes in output over time is unrealistic because marginal costs and input prices are likely to change period by period (changes in the elasticity, production technology will likely take more time). Combining equations [1] and [2],

The ratio of cost minimizing capital K and labor L inputs is proportional to the ratio of the respective elasticity of output to the input in the production function, and inversely proportional to the ratio of the respective prices, with the price of capital equal to the user cost. If the relative prices of labor and capital inputs change over time, the ratio of capital to labor desired by firms (cost minimizing and profit maximizing) will also change. From the observed and estimated labor and capital input prices it is possible to empirically observe changes in relative prices and if the observed input mix adjusts accordingly to what would be expected from the changes in relative input prices or not. If input prices and relative input quantities change over time the theories of investment that predict proportionality between changes in output and changes in investment would fail to explain the observed evolution in capital formation.
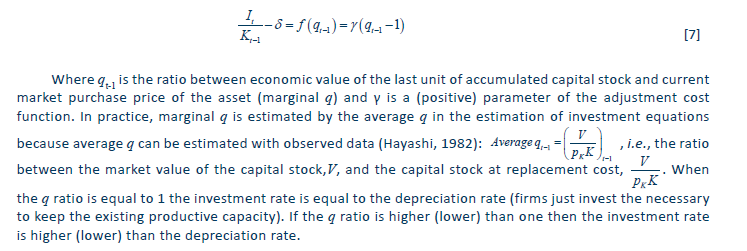
One limitation of the accelerator theory is that output is taken as exogenous and there is no place for expectations. Tobin introduced expectations in the theory of investment with the prediction that firms will invest until the market value of one asset (presumably estimated by the present value of the cash flows that the asset generates to its tenant) is equal to the cost of replacing it (Tobin, 1969; Brainard and Tobin, 1968). For a firm that is listed in the stock market, the expectations of investors about the future cash flows are reflected in the market value of the issued shares and bonds. Then, the investment rate of firms is related to the ratio between the marginal economic value of the last unit of investment in capital services, and the purchase or replace cost of the unit of capital service in the market, ratio known as marginal Tobin’s q. Tobin’s theory of investment can be reconciled with the neoclassical-present value maximization approach with the extension of the model to include explicitly an adjustment cost function into the optimization problem.
Assuming a quadratic cost adjustment function, the investment equation that results from se so called Tobin’s q theory of investment is given by,
These theories of investment assume that firms have access to all funds needed to finance the capital investment at the interest rate used to discount the future cash flows. However, the possibility that firms face financial constraints cannot be excluded and it should be accounted for when explaining capital investment. Frictions in the financing of capital investment may be the result of information asymmetries between the firm and the external financiers, in which case firms may find cheaper to finance investment with internal generated firms (retained earnings) than with externally supplied one.
We now provide some evidence that can provide some light on how these theories may have determined the observed capital investment of Spanish NFC in the period of study documented in the previous section.
4. DO THEORIES EXPLAIN CORPORATE INVESTMENT BEHAVIOR?
4.1. Accelerator
This section shows the results from the analysis of the data on capital investment with the lens of the theoretical predictions presented above. The first evidence is presented in Figure 8 that shows the correlation between the annual change in output, ∆Qt, and the year t flow of net capital investment as proxy of ∆Kt, as predicted from the more straightforward formulation of the accelerator theory, equation [3].
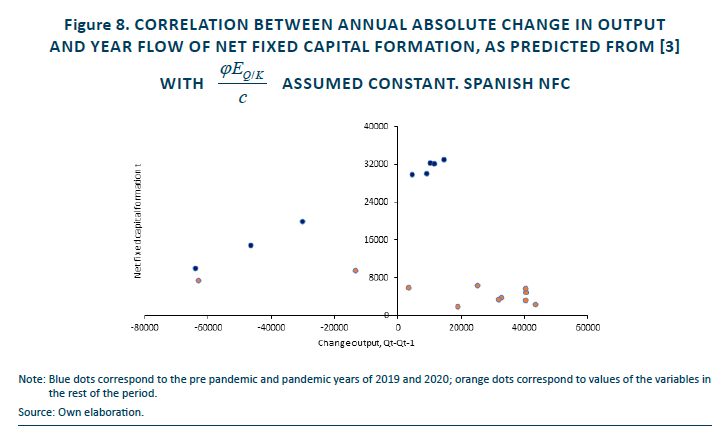
The blue dots correspond to pairs of values in the period 2019-2020, i.e., the values in the quarters during the pre-pandemic and the pandemic period. The orange dots correspond to values for the post pandemic values, from 2021 till 2023. The correlation between change in output and net fixed capital formation is positive and high in the pre pandemic and pandemic periods; however, in the post pandemic period the values of the two variables are uncorrelated.
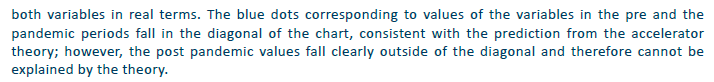
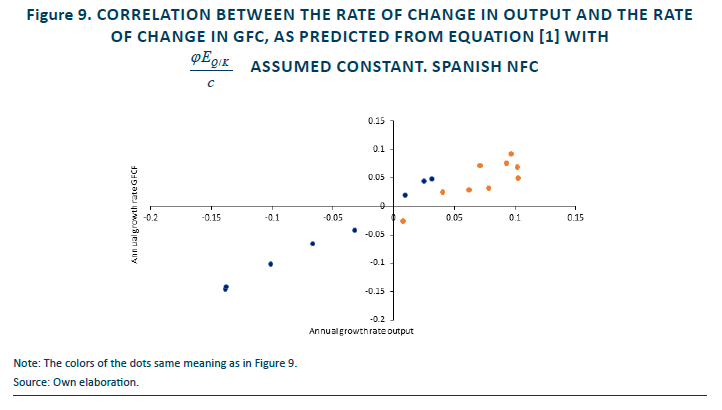
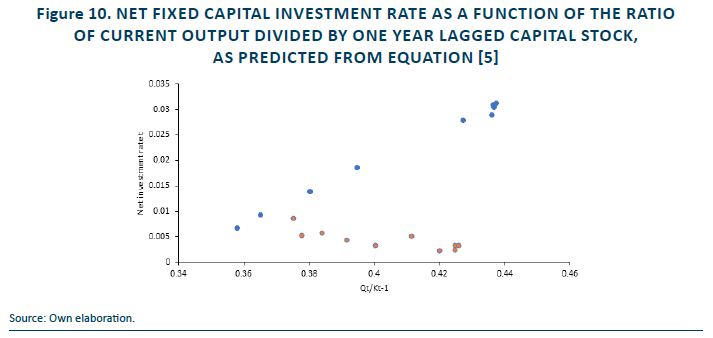
Figure 10 shows the correlation between the variables in equation [5] that corresponds to the accelerator theory of investment with adjustment costs from transiting to the current to the desired capital stock after exogenous changes in output. The same conclusion applies: the observed correlation between the two variables is consistent with the theory in the pre pandemic and pandemic periods but not in the recovery period.
4.2. Relative input prices and production input mix
The evidence from Figure 8 to 10 casts doubts that the accelerator theory of investment can explain the corporate investment behavior of Spanish NFC in the recovery period. Most likely, the hypothesis of the theory that the user cost of the capital input and/or the production technology remain stable over time, does not hold in the recovery period (although it might have hold in the pre and pandemic one). This section examines the possible changes in labor and capital input prices during the period, and if the changes might have affected the relative optimal mix of the two inputs in production, as predicted by equation [6].

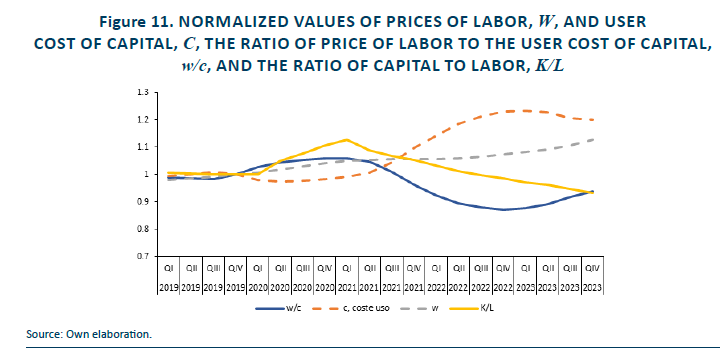
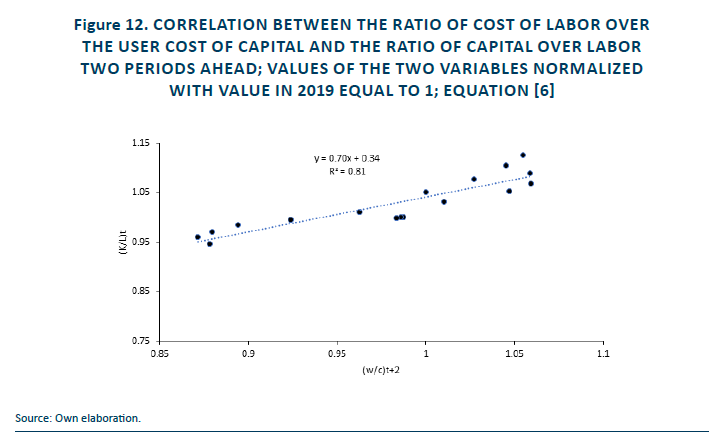
The unit prices of labor and capital experienced a moderate increase in the pre pandemic year of 2019. In the pandemic period the user cost of capital decreased (due to the deflation in the market price of capital services) while the unit labor cost increased at a moderate rate, an increase that has continued along the whole time period; consequently, the cost index of labor in 2023 is 12,7% higher than the pre pandemic value in 2019. The estimated user cost of capital increases at an accelerated pace during the year 2022, coinciding with the inflationary episode (Ukrainian war, energy prices). During 2023 the inflation in the prices of capital services decreases and so it does the user cost of capital. Overall, in the post pandemic period, the user cost of capital increases at a higher rate than the cost of labor and consequently, the ratio of cost of labor to the user cost of capital decreases in parallel. Equation [6], from profit maximizing firms, predicts that if capital is becoming relatively more expensive than labor then ratio of capital to labor in production will decrease in parallel. Figure 12 shows graphically the positive correlation between the ratio of labor to capital costs and the ratio of capital to labor, both ratios expressed in logs and the ratio of input prices lagged one period.
4.3. Incentives to invest
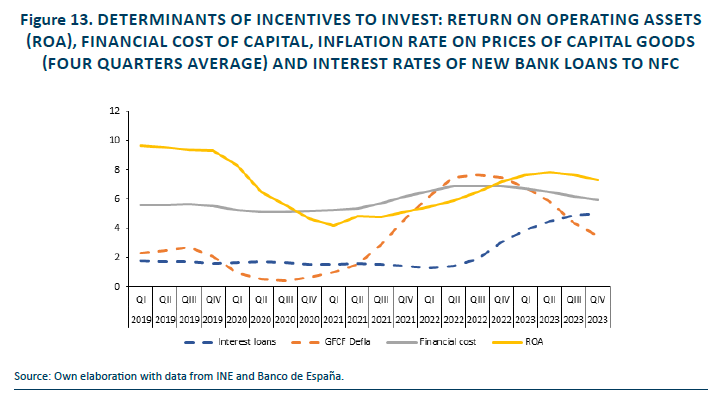
The return on assets (ROA) for the aggregate of the Spanish non-financial corporate sector, before profit taxes taxes, evolved from above 9% in the pre-pandemic year of 2019 to the minimum value slightly above 4% in the pandemic first quarter of 2021. The decline in ROA can be attributed to both a decrease in profit margin (operating profits per euro of gross value added, GVA) and a reduction in the ratio of GVA to the capital stock (numerator and denominator at current prices). From the second quarter of 2021 onward, the rate of return steadily ascended until the second quarter of 2023, but in the third and four quarter of this year it decreased again. In 2023, the year average ROA was 7.2%, two percentage points lower than the ROA in 20194.
The financial cost of capital exhibited fluctuations throughout the period, following a similar pattern to that of the ROA but with less volatility around the estimated period average of 6%. While the ROA surpassed the financial cost of capital in the pre-pandemic year of 2019, during the pandemic and part of the recovery period, the ROA fell below the financial cost of capital. By the end of the recovery period, however, the ROA once again surpassed the financial cost of capital due to higher profit margins and increased rotation of the capital stock. Nonetheless, the gap between ROA and financial cost of capital in 2023 was narrower than that observed in 2019.
Under certain assumptions regarding the perpetuity of profit flows, the ratio between the net rate of return of operating assets and the financial cost of capital can approximate the economic value of the firm’s assets. Consequently, the ratio between ROA and the financial cost of capital can serve as a proxy for average Tobin’s q5. In 2019, this proxy indicated strong incentives for NFC to invest in capital (Tobin’s q greater than one). However, these incentives waned during the pandemic and much of the recovery period, when Tobin’s q fell below one. In 2023, the proxy of Tobin’s q surpassed 1 again, albeit not to the extent observed in the pre-pandemic period.
The inflationary episode of 2022 impacted the prices of capital goods, with the inflation rate during that year nearly four times higher than the pre-pandemic inflation rate. Although the price inflation of capital goods experienced a sharp decline in 2023, the year-average remained higher than pre-pandemic values. The interest rates charged by banks to NFC for new loans remained stable for the most part of the period, hovering below 2%, while official interest rates remained low, even negative. However, with the change in monetary policy response to the inflationary episode by the ECB, official interest rates and bank loan interest rates surged sharply. By the end of the sample period, the interest on new loans averaged around 5%, surpassing the inflation in prices of investment goods (positive real interest rates).
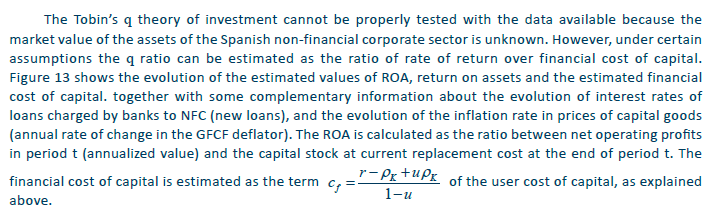
The evolution of the interest rate of loans did not significantly impact the estimation of the financial cost of capital in this study, owing to assumptions regarding the constancy of after-tax real rates of return expected by investors, r – ρk= 0.04 by assumption. Instead, changes in the estimated financial cost before taxes over time were primarily driven by fluctuations in the price inflation of capital goods, affecting the cost of capital through the corporate profits tax rate uρk..
The rates of growth of the capital stock and investment rates, as depicted in Figures 6 and 7, broadly align with the incentives to invest inferred from Figure 13, except towards the end of the period. In 2019, when Tobin’s q was notably above one, the annual net capital investment rate hovered around 3%. However, throughout the period, with Tobin’s q ratio below 1, both the net capital investment rate and capital stock growth remained virtually stagnant. The exception occurred in 2023, when the rate of return on capital once again exceeded the financial cost of capital (indicating Tobin’s q ratio greater than one), yet the investment rate remained flat around zero.
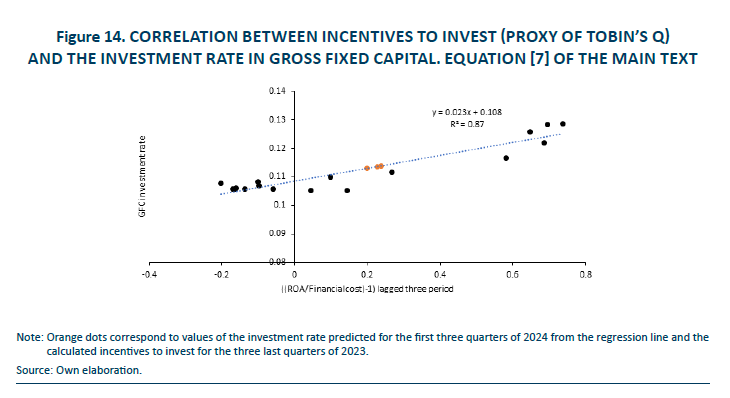
Figure 14 summarizes the results of correlating the incentives to invest with the gross fixed capital formation investment rate (similar conclusions apply if considering the net investment rate), assuming a three-quarter lag between the decision to invest and the actual investment flow reported in national accounts (suggested by the data). The correlation is positive and statistically significant. The regression line’s intercept equals the estimated depreciation rate implicit in the data; when the incentive to invest is zero (ROA equals cost of capital), the gross capital investment rate matches the depreciation rate (10.8% estimated by the model). The figure also projects the investment rates for the three quarters of 2024 and the incentives to invest calculated for the same period, indicating an improvement in investment incentives in 2023, which should translate into higher observed investment rates in the near future. However, actual investment rates in 2024 will be influenced by additional factors not captured by historical data, including increasing political uncertainty and the acceleration of NGEU projects’ execution.
4.4. Excess capacity
The evolution of inputs and output in Figure 5 suggests that the pandemic has affected the time dynamics of the use of inputs in production, relatively to their quantities available, particularly in the worst moments of the pandemic. We now explore the relationship between actual output and an estimate of the production capacity calculated based on the quantities of inputs available during the period of study. For that purpose, we estimate the parameters of a hypothetical production function representative of the inputs-output relationship in the pre-pandemic year of 2019; next, with the estimated parameters of the production function and the observed values of labor and capital inputs, we simulate the hypothetical production capacity of the Spanish non-financial corporate sector; finally, the estimated production capacity is compared with the observed output6. The results of the estimation and comparison appear in Figure 15.
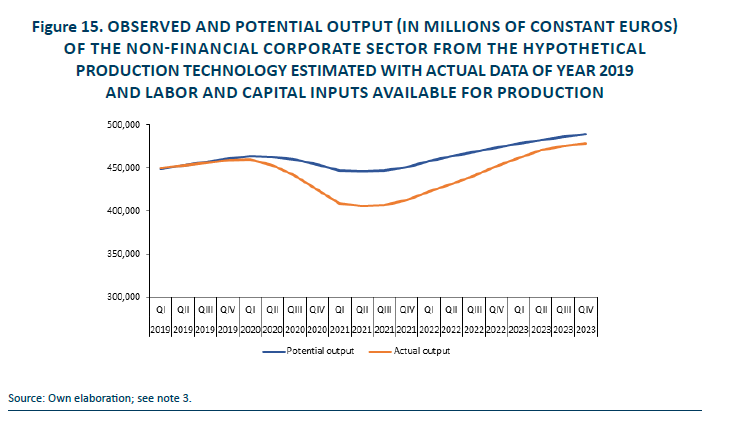
The production function effectively elucidates the evolution of output throughout 2019, aligning with expectations based on the calibration of technology parameter values. However, from 2020 to 2023, potential output consistently exceeded observed output, indicating that the Spanish non-financial corporate sector operated with excess capacity, with peak excess values reaching up to 10% during the height of the pandemic. The narrowing of the gap between potential and observed output during the recovery period suggests that actual output grew at a faster pace than expected based on the growth in input quantities, namely labor and capital. This phenomenon is primarily attributed to the utilization of inputs derived from the excess capacity. Nevertheless, the gap persisted in 2023, with potential output surpassing observed output by 2.5%.
Several factors could account for the ongoing gap. Firstly, it’s possible that the total factor productivity of the corporate sector in 2023 is lower than in 2019, thereby impacting output levels. Additionally, changes in relative input prices and non-constant elasticity of substitution may have led to the adoption of more labor-intensive production technologies in 2023 compared to 2019. Moreover, shifts in the composition of the economy, such as a higher proportion of labor-intensive sectors like tourism and a reduced presence of manufacturing, could contribute to the persistence of the gap. Lastly, calculation errors in the measurement of variables cannot be entirely ruled out as a potential explanation.
4.5. Financial conditions
The preceding discussion operates under the assumption that firms have access to the necessary funds to finance their capital investments at the user cost of capital. This section delves into whether the trajectory of financial variables might have influenced investment decisions in ways not previously considered.
Firstly, evidence from Figure 16 shows the time evolution of the allocation of internally generated funds (net profit plus capital consumption) across the NFC sector. These funds are allocated into gross fixed capital investment, dividends payments, and any remaining generated funds. A positive net difference between generated and used funds signifies that, on aggregate, internally generated funds exceed those expended to finance new capital and pay dividends, whereas a negative allocation indicates that firms required additional external funds to finance new investments and pay dividends.
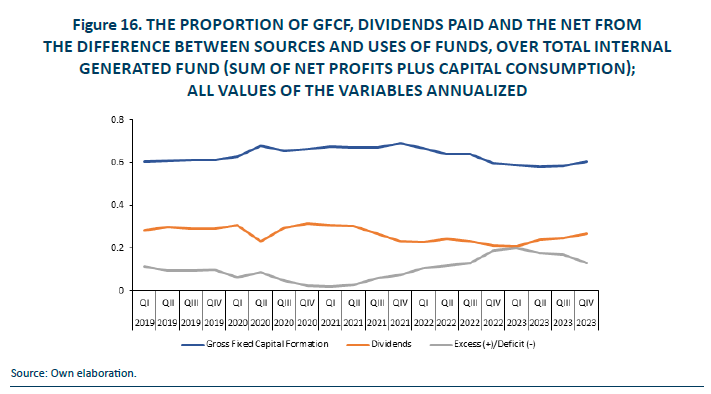
The allocation of internal generated funds in the pre pandemic year of 2019 were approximately, 60% to finance gross fixed capital formation, 30% to pay dividends, with 10% of the total left. During the pandemic, years 2020 and 2021, the Proportion of GFCF over internal generated funds increased to 70% because of the contraction in the internal generated funds (reduction in net profits). During the recovery years of 2022 and 2023 the internal generated funds increased and the proportion of GFCF decreased so that by the end of 2023 the ratio reached pre pandemic values of 60%. The evolution of the proportion of dividends paid over the internal generated funds has been first stable (2019-2020), next decreasing (2021 and 2022) and finally increasing (2023) approaching pre pandemic levels. The internal generated funds, in the aggregate, have always been higher than the uses in financing capital investment and paying dividends; therefore, for the aggregate of the corporate sector there is no evidence of financial constraints limiting the capacity to invest.
Since firms have the option to finance their investments with external funds, such as debt, in addition to internally generated funds, Figure 16 is complemented with information from Figure 17. Figure 17 illustrates the availability of funds in the form of internally generated funds not distributed as dividends, alongside new bank loans categorized by size –small (250,000 euros or less), small and medium (up to 1 million euros), and large (more than 1 million euros). The Figure also includes the gross fixed capital formation at current prices. In 2019, prior to the pandemic, the total inflow of funds –from both bank loans and retained internally generated funds– in the Spanish corporate sector amounted to approximately 680 billion euros, roughly four times the annual flow of GFCF. Amid the pandemic, this total flow slightly decreased to a minimum of 560 billion euros in 2021QII (a 17% decrease). Subsequently, the flow of funds rebounded, returning to pre-pandemic levels by 2023. Throughout the period, the ratio of total funds to GFCF remained relatively stable, except during the height of the pandemic in 2021 when it dipped to 3.6. Retained funds constituted approximately 30% of the total funds, with the remainder sourced from bank loans. During the pandemic, there was a decrease in internally generated funds, compensated by an uptick in bank loans, particularly those of small and medium sizes.
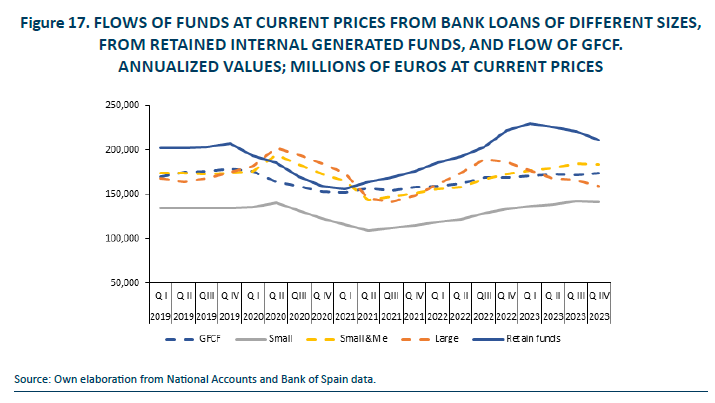
New bank loans saw a moderate increase during the recovery period, alongside nominal capital investment flows and retained funds. Notably, loans exceeding 1 million euros exhibited a steady decline since mid-2022, coinciding with a period of rising interest rates. Interestingly, during this period, despite economic incentives from the recovery of the rate of return on assets (ROA), investment flow did not respond, and large firms seemed to prefer internal generated funds over bank debt to finance their capital investments when nominal interest rates rose.
Regarding the central question of whether financial constraints could have influenced the recovery of capital investment in the non-financial corporate sector, the evidence suggests otherwise. Firstly, the ratio of total funds flow to gross fixed capital formation during the recovery was slightly higher, not lower, than its historical value. Secondly, while the mix of internal and external finance may have shifted –with a relative increase in internal funds and decrease in bank debt– the total available funds did not decrease.
5. CONCLUSION
Evidence indicates that the recovery of capital investment in the Spanish non-financial corporate sector from pandemic-induced lows lags behind expectations based on the evolution of output and employment. This disparity is also observed when comparing data with corporate sectors of other EU countries and across other institutional sectors of the Spanish economy (public administrations and households-not for profit). This report aims to provide an explanation for the lag in corporate capital investment recovery by drawing on economic theories of capital investment, particularly neoclassical, accelerator, and Tobin’s q theories. Additionally, it explores whether financial conditions and constraints may have influenced Spanish firms’ capital investment decisions over the five-year study period.
The evolution of the capital stock and net investment rate aligns with predictions from the neoclassical theory, reflecting changes in input mix in production –more labor and less capital– parallel to an increase in the user cost of capital relative to labor costs during the inflationary episode. Furthermore, economic incentives to invest, as captured by estimates of Tobin’s q, may have influenced investment decisions if delays between decision-making and project execution contributed to the lag in capital formation recovery. However, these incentives were also influenced by excess capacity prevalent in the corporate sector over the past four years. In fact, excess capacity explains much of the variability observed in net profit margin and ROA during the study period (see Appendix 2). Additionally, the more pronounced contraction of output in the Spanish economy during the pandemic compared to other EU countries could explain the prolonged lag in corporate capital investment recovery in Spain.There is insufficient evidence to support the hypothesis that financial constraints influenced firms’ capital investment decisions during the study period. However, the substantial increase in interest rates toward the end of the sample period may have prompted a shift in finance mix, with more reliance on retained earnings and less on bank loans, particularly among large firms.
Looking ahead, the evolution of corporate investment will depend largely on the convergence of the output gap to zero, which has yet to occur by the end of 2023. Low inflation in prices of capital goods and low interest rates could positively impact capital investment. Additionally, if salaries continue to rise to recover purchasing power and the cost of capital remains stable or decreases, it is expected that the desired input mix will shift again towards more capital and less labor. Progress in the elimination of the output gap will increase the rate of return, which coupled with lower relative prices of capital services, will boost demand for capital and investment flows. It will be crucial, however, to ensure that rising labor costs do not negatively impact profit margins. The remedy may lie in enhancing production efficiency to maintain constant profit margins and prices.
Comparative analysis of capital formation across Spanish institutional sectors suggests that the impetus provided by NGEU programs and funding could be a major contributing factor to the increase in gross and net capital formation in the public sector post-pandemic. In the pre-pandemic period, the net capital investment flow of the public administration sector was negative, indicating that gross fixed capital investment was insufficient to offset the consumption of existing capital. However, by 2023, the public administration sector leads in the growth of gross and net capital investment flows. Going forward, the execution of projects financed with NGEU funds in the private sector is expected to increase, further bolstering capitalization in the corporate sector of the Spanish economy7.
References
Aguilar, P., Ghirelli, C. and Jiménez-García, B. (2023). La evolución reciente de la inversión en España desde una perspectiva macroeconómica. Boletín Económico – Banco de España, 2023/T3, 03. https://doi.org/10.53479/30649
Brainard, W. and Tobin, J. (1968). Pitfalls in Financial Model Building. American Economic Review, vol.58, no.2, pp. 99-122.
Cuadrado, P., Izquierdo, M., Montero, J., Moral-Benito, E. and Quintana, J. (2022). El crecimiento potencial de la economía española tras la pandemia. D.O. 2208, Banco de España. https://repositorio.bde.es/handle/123456789/21016
Domenech, R. and Sicilia, J. (2024). Investment in Spain and in the EU. BBVA Research file:///Users/usuario/Downloads/Observatorio_La-Inversion-productiva-en-Espana-ene2024_ENG_edi.pdf
Eklund, J. (2013). Theories of Investment: A Theoretical Review with Empirical Applications. WP 2013:22, Swedish Entrepreneurship Network.
Hayashi, F. (1982). Tobin’s Marginal and Average q: A Neoclassical Interpretation. Econometrica, vol. 50, no.1, pp. 213-224.
Hernández de Cos, P. (2024). Situación y Perspectivas de España en el área del euro. Banco de España. https://www.bde.es/f/webbe/GAP/Secciones/SalaPrensa/IntervencionesPublicas/Gobernador/Arc/Fic/IIPP-2024-03-19-hdc-es-or.pdf
Jorgenson, D. (1963). Capital Theory and Investment Behavior. American Economic Review, vol.53, no.2, pp. 247-259.
Maudos, J., Mollá, S. and Pérez, J. (2023). Fondos Next Generation European Union destinados a actuaciones de I+D+i y digitalización. Fundación COTEC e Instituto de Valenciano de Investigaciones Económicas. https://www.ivie.es/wp-content/uploads/2023/01/Estudio-Fondos-NextGen-destinados-a-ID.pdf
Salas Fumás, V. (2022). La Empresa Española: Del Euro a la COVID19. Prensas de la Universidad de Zaragoza
Tobin, J. (1969). A General Equilibrium Approach to Monetary Theory. Journal of Money, Credit and Banking, vol. 1, no.11, pp. 15-29.
Torres, R. (2023). La Brecha de Inversión Productiva. El País-Funcas. https://elpais.com/economia/negocios/2023-09-10/la-brecha-de-inversion-productiva.html
Notes
* Emeritus Professor University of Zaragoza and Funcas.
1 More detailed explanations of variables definitions, measurement and interpretation of the results along the paper can be found in Salas-Fumás (2022).
2 From the balance sheets data for the Spanish institutional sectors published by the INE, housing represents more than 92% of the total fixed non-financial assets of households (compared with 25% in the corporate non-financial sector). Therefore, the increase in capital formation in the household and not for profit sector will be mostly increase of investment in housing by households.
3 For a short summary of the economic theories of capital investment see Eklund (2013).
4 The operating assets included in the calculation of the ROA include only the fixed operating assets. In reality, however firms permanently invest in working capital (cash plus inventory plus debt from customers minus debt to suppliers). Salas Fumás (2022) estimates a positive working capital for the aggregate of the Spanish NFC that implies a total operating assets around 10% higher than only the fixed assets. Therefore, the ROA calculated with total operating assets would roughly be 10% lower than the shown in Figure 13.

6 The proposed hypothetical production function is QP = 4.1L0.57 K0.33. The power coefficients are estimated from the cost shares of labor and capital for the year 2019, and the total factor productivity parameter was adjusted so that predicted and observed output in 2019 coincide. From equations (1) and (2) and price equal to marginal cost, the labor and capital cost shares are equal to the respective elasticity parameters of the production function. Notice that the sum of the estimated cost shares is less than one, meaning that production takes place under decreasing returns to scale.
7 For different analysis and conclusions about the deployment of NGEU projects and investment in Spain see Aguilar et al. (2023), Maudos et al. (2023) and Cuadrado (2022).
APPENDIX 1
THE EXTRAORDINARY GROWTH OF THE FINANCIAL CORPORATE SECTOR IN 2023
Figure A1.A plots the annual growth rate in output, nominal and real, and the annual growth of the implicit price deflator for the financial services/financial corporate sector of the Spanish economy with data from official statistics (INE). The Figure shows the extraordinary nominal growth of financial service sector in years 2022 and 2023 coinciding with the rise in official interest rates; the growth in real terms, however, is much smaller and the difference between nominal and real rates shows up in the high rate of change in the implicit deflator. For example, in 2023 the annual rate of change in implicit deflator of the output of the financial service sector is 33.6%, compared with the 6% annual change in the GDP deflator of the economy.
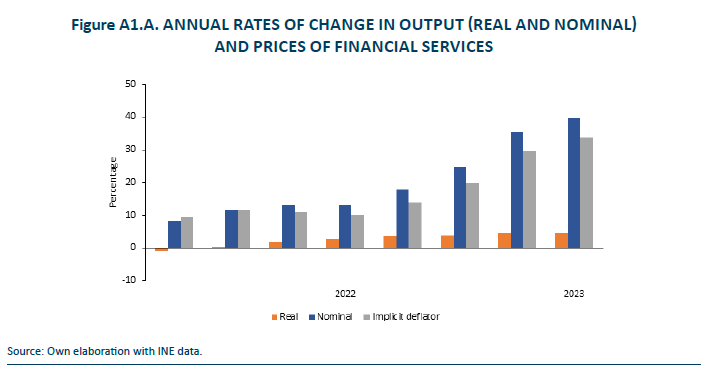
Figure A1.B confirms the gap between the evolution of the deflator of the financial service sector (base 1, 2019) and the GDP deflator of the Spanish economy. Since the GDP deflator of the economy includes the deflator of financial services, the extraordinary high deflator of financial services in 2023 distorts the value of the deflator of the non-financial corporate sector of the economy. In other words, in 2023, the GDP deflator of the economy will over-estimate the deflator of the output of the non-financial corporate sector (not published by the INE). This in turn will infra estimate the real output of the non-financial corporate sector when using the GDP deflator of the economy to calculate it. To minimize the measurement errors, we re-estimate a price index to deflate the GVA of the non-financial corporate sector, free from the distortion caused by the extraordinary growth of the financial services deflator in the year 2023. The re-estimation consists in eliminating the contribution to the GDP deflator of the economy of the deflator of financial services implicit in the INE data, for the whole period of study.
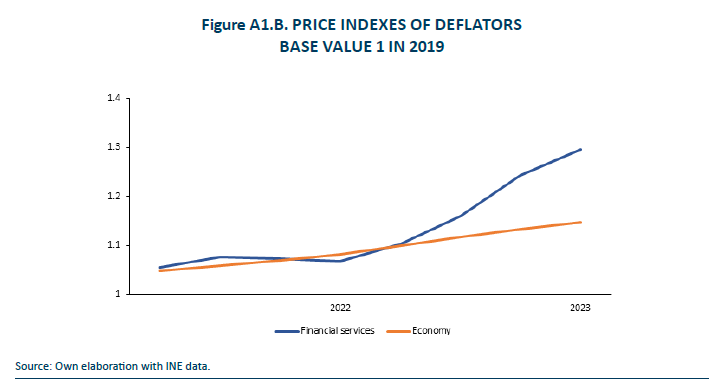
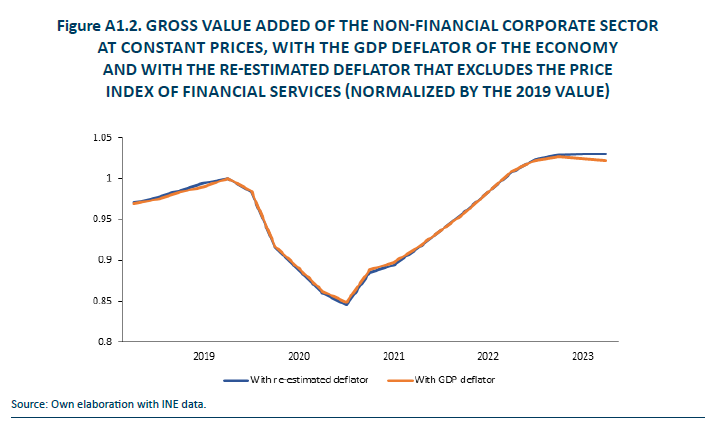
Figure A1.2 shows the evolution of the real output of the non-financial corporate calculated with the official GDP deflator, and that calculated with the re-estimated deflator excluding the contribution of the financial services deflator. Notice that the differences are visible only for the last three quarters of 2023 when the deflator of the financial services takes its anormal values; by the end of 2023 the output of the NFC sector is 1% higher with the adjusted deflator than without the unadjusted one. The measure of output used in the calculations in the main text is the adjusted one.
APPENDIX 2
BUSINESS PROFITABILITY AND THE ECONOMIC CYCLE
The accounting profits of a firm will be equal to revenues minus costs. The revenue will be equal to price times quantity. The costs can be classified in variable costs, which vary with the level of output, and fixed cost that do not vary with output as long as output does not exceed production capacity. We will assume that the composition of fixed and variable cost will depend on the occupation of existing capacity. The occupation, in turn, will be measured in different ways, the ration of output to the capital stock and output gap (ratio between potential and actual output).
The accounting profit is defined as

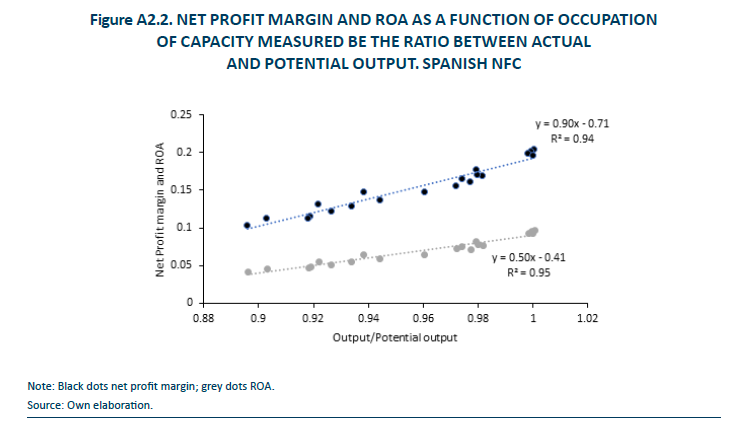
Where p is the selling price, cv is variable cost per unit of output, Q is the output flow and F is the fixed cost, including depreciation of existing capital stock. K is the stock of capital services that sets the short-term capacity of the firm. The profit margin or profit per unit of sales is equal to,
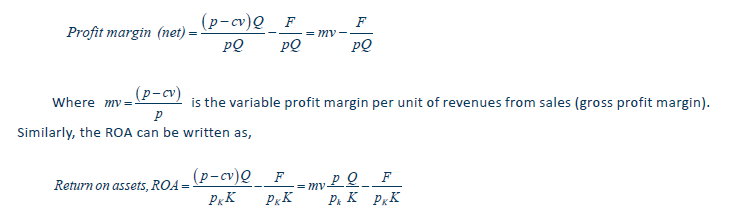
Our claim is that the net profit margin and the ROA will vary over time in response to the evolution of the occupation of existing capacity, with profit margin and rate of return increasing with occupation.
Figure A2.1 shows the correlations between net profit margin and ROA, each separately, and occupation of capacity measured by the ratio between output and capital stock, Q/K. As expected, the correlation between occupation of capacity and the profitability variables is positive: the fixed cost will be associated with the fixed capacity so higher occupation of capacity, i.e. higher output, will imply a lower fixed cost per unit of output and higher net profit margin.
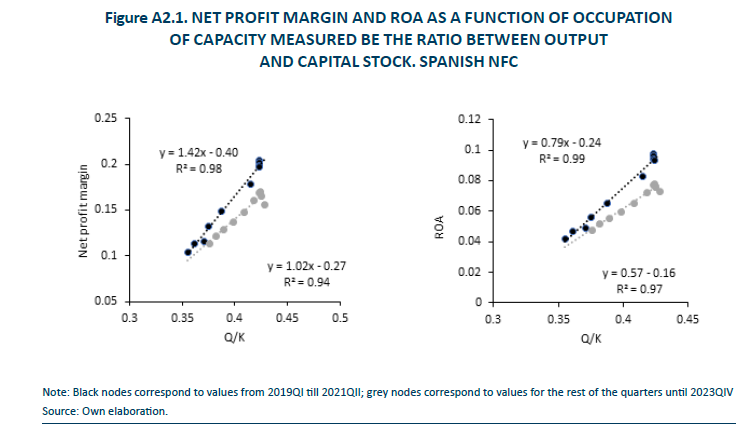
The relation between net profit margin and the proposed measure of capacity occupation is different in the subperiod from 2019Q1until 2021QII, and in the subperiod after. In the first subperiod the estimated negative intercept and positive slope are higher in absolute values than those estimated in the second sub period. The higher intercept in absolute value implies relatively lower variable cost over the value added (around 60%, i.e., 1-0.40) in the first subperiod than in the second (around 73%, i.e., 1-0.27). The opposite will happen with the share of fixed costs and therefore the variability in occupation of capacity has higher marginal effect in the pre and pandemic period than in the recovery (slope of 1.42 versus 1.02). Keep in mind that pandemic started with relatively high occupation of capacity (higher proportion of variable costs) while the recovery started with relatively low occupation (higher proportion of fixed costs).