
Fecha: Primera versión, julio 2023
Pilar Rivera Torres* and Vicente Salas Fumás**
Cost and price inflation with firm level data: An empirical analysis◆
Cost inflation, Pass-through, Market power, Competition
This paper presents estimates of the elasticity of price increases to cost increases in a sample of Spanish firms, during the cost-driven inflationary episode of years 2022 and 2023 (forecasts). We find that the sample average elasticity of price to cost changes is less than one, and higher among firms that perceive more intense competition than among firms that perceive an environment of less competition. We also find that the pass-through of cost increases to price increases takes place with time lags that are shorter among firms in more competitive environments. Finally, when controlling for cost increases, changes in profit margins are independent of price increases, which would rule out that recent inflation has been driven by market power. These results are consistent with predictions from the theory of price formation in imperfectly competitive product markets, and they should be relevant for the assessment of how competition policy can contribute to fighting inflation.
1. INTRODUCCIÓN
After years of stable and low rates of increase in the level of prices, inflation across OECD countries has risen to levels substantially above policy target levels (2% for central bankers). The causes and consequences of inflation have been a topic of worrying concern for macroeconomic research and policy. In the macro view on inflation, short term variations in the general level of prices are explained by mismatches between aggregate supply and aggregate demand that central bankers try to minimize adjusting the official interest rates. There are, however, other voices that view the inflationary episode as a direct consequence of the historically high levels of firms’ market power and profits (Koltay, Lorincz and Valletti, 2022; Vernengo and Perez Caldentey, 2023).1 Inflation has also become a topic of microeconomic concern, with voices asking for competition policy becoming part of the fight against it.2
This paper sets the hypothesis that the recent price inflation has been mainly determined by the cost inflation produced as a result of the negative shock in the energy and in the agriculture products’ markets that followed the Russian invasion of Ukraine, when the world had not yet fully recovered from the damages caused by the COVID-19 pandemic. The hypothesis is tested with estimates of the average pass-through of relative cost increases to relative price increases, using survey data provided by firms located in the region of Aragón (Spain) in November 2022. Firms were asked about their estimated changes in production costs for the year 2022 and for their estimated forecast for cost changes during the year 2023. Similarly, they were asked to report the respective rate of price increase in 2022 and forecasted for 2023. The estimation allows for differences in the price-cost elasticity in the subsample of firms that perceive higher competitive pressure, and in the subsample of firms that perceive medium or low competition pressure. A third specification of the empirical model considers the possibility of time dynamics in the pass-through of cost increases into price increases, with differences in the speed of transmission across firms that have different perception about the intensity competition in their product markets.
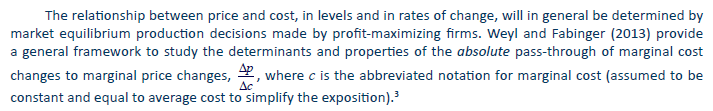
The paper formulates two research questions that will be responded theoretically and empirically: i) is the elasticity of price to cost changes greater (cost amplifying) or lower (cost absorbing) than one?, and ii) how market competition intensity affects the elasticity of price to cost? The elasticity of price to cost changes is a measure of the relative pass-through, i.e., the rate of change in unit cost that is passed to a rate of change in selling price. When costs increases are generalized across firms and markets, then we refer to the situation as cost inflation; for generalized positive relative pass-through the cost inflation will turn into a cost driven price inflation. The relative pass-through is determined as an equilibrium outcome of firms making profit maximizing decision in competition within a market of given competition conditions. The paper extends the results of Weyl and Fabinger (2013) on the determinants of the absolute pass-through, to predictions on the determinants of the relative pass-through, the main variable of interest in this paper.
It turns out that the relative pass-through is equal to the absolute pass-through divided by the market power of firms in the market equilibrium, calculated as the ratio between price and marginal cost. The relative pass-through will determine the rate of price inflation (rate of increase in prices) for a given level of cost inflation. The market power determines the level of price as a function of the level of cost. For a given absolute pass-through, the relative one will be lower in markets with higher market power. Therefore, for a given cost inflation, the resulting price inflation will be inversely related to market power and therefore, directly related to market competition. Market competition is effective in keeping the price level close to the cost level and, dynamically, to push the price and the cost level down if competition acts as a stimulus for innovation. But if the reason of cost inflation is an external shock, then the resulting price inflation can be higher in more competitive markets than in less competitive ones.
According to the survey data practically all firms in the sample respond positively to the question of whether their costs increased during 2022, and all of them also coincide in that the main reasons behind the cost raises have been higher prices of energy, raw materials and intermediate inputs. The estimated elasticity of price to the cost increases is, on average for the whole sample, above 0.5 but less than one, i.e., the pass-through is cost absorbing in the sample data. This means that, on average, the firms in the sample will experience decreases in profit margins during the two-year period; the prediction is confirmed by the response of the surveyed firms to the direct question about the rate of change of their respective profit margins in 2022 and 2023. The estimated relative pass-through is higher in the subsample of firms that perceive a more competitive environment than in the subsample that perceives a less competitive environment. In addition, the pass-through is not instantaneous but costs increases appear to be gradually translated into price increases along several periods of time, faster in the subsample of firms that perceive a more competitive environment (faster) than in the subsample of those that perceive a less competitive environment. Finally, the hypothesis that price inflation has been driven by market power effects is rejected by the data.
The results from previous empirical research on similar topics are mixed, both in the magnitude of the pass-through, and in the sensitivity of this magnitude to the competitive environment. Miller, Osborne and Sheu (2017), with data from regional cement markets in the US, estimate an absolute pass-through higher than one and find that the absolute pass-through is lower in more competitive market structures. Brauning, Fillat and Joaquim (2022), across different industries and products, estimate a pass-through lower than one and find that the translation of cost increases to price increases is higher in more concentrated product markets than in less concentrated ones. Fabra and Reguant (2014) find that the costs charged for CO2 emissions in EU firms are almost fully passed to electricity prices for final consumers. On the other hand, Cabral, Geruso and Mahoney (2015) and Genakos and Pagliero (2022) find evidence of cost absorbing pass-through, with the magnitude of the pass-through increasing with market competition. For example, Genakos and Pagliero estimate a pass-through of 44% of gasoline taxes to gasoline prices in local markets with one competitor, and a 100% pass-through in local markets with four or more competitors.
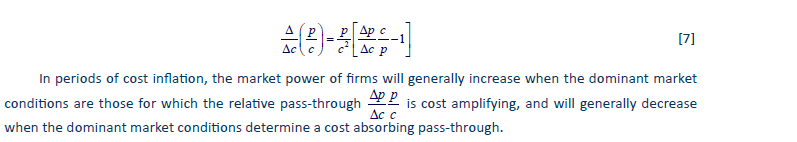
The paper contributes to the literature on pass-through with new evidence on estimates of relative pass-through with data on yearly cost and price changes directly collected from a sample of firms. The paper also contributes to a better understanding of the relationship between market power and inflation. From the relation between relative pass-through and market power, in periods of cost inflation, market power will increase or decrease depending on whether the relative pass-through is cost amplifying or cost absorbing, respectively, which depends on the properties of the product demand function as shown in the theory section. Therefore, market power could increase in periods of cost-driven inflation if the dominant demand function across final products was log convex, but the increase in market power would not be the cause of price inflation. Moreover, since the structural market conditions that determine a relatively low pass-through are the same that contribute to higher market power of firms, given a rate of cost increase the translation to price inflation will be lower in markets with high market power than in markets with low market power.
The results of the paper should then be relevant in the assessment of the effectiveness of competition policy to fight inflation. In a recent publication, the OECD (2022; p. 32) concludes that: Competition is vital for a low inflationary environment and competition enforcement should be prioritized, but not at the expense of fiscal or monetary policy. To hold competition authorities accountable for general inflation is likely to be both unrealistic and unproductive. The results of this paper would indicate that monetary and fiscal policies do not provide the first line of protection against episodes of cost and price inflation in situations as the present ones, when cost inflation is caused by shocks external to the national economies (increase in prices of imported energy, for example). The results do not question, however, the effectiveness of monetary and fiscal policies against second-round effects. The results would also support the view that competition authorities can do more to determine the levels of costs and prices than to affect their relative changes over time.
The rest of the paper is organized as follows. Section one outlines the theoretical framework on price formation. Section two explains the data collection processes and describes the contents of the survey more closely related to the topic of this research. Section three presents descriptive information on yearly changes in cost, price and margin and on other variables relevant for the analysis. Section four shows the results of the estimation of the empirical model, including extension and robustness. Section five discusses the empirical results within the context of the main questions posed by the research. The paper ends with a conclusion that summarizes the findings and their implications for the potential of competition policy in fighting inflation.
2. CONCEPTUAL FRAMEWORK
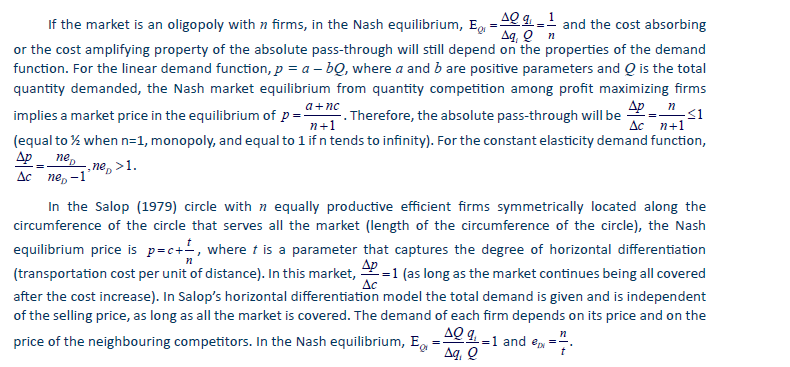
The conceptual framework to study the link between cost and price inflation in this paper is the theory of price formation in markets that differ in structural competitive conditions, such as the number of firms and/or product differentiation.
One key element in price formation that has been related to price inflation and that serves as justification for those who support the use of competition policy to fight inflation is the power of firms to set selling prices. The measure of market power, k commonly used in the literature is the ratio or distance between selling price and marginal cost (De Loecker, Eeckhout Unger, 2020), as follows:

The price to marginal cost ratio has a one-to-one correspondence with the Lerner index or relative profit margin, the more traditional measure of market power,
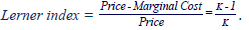
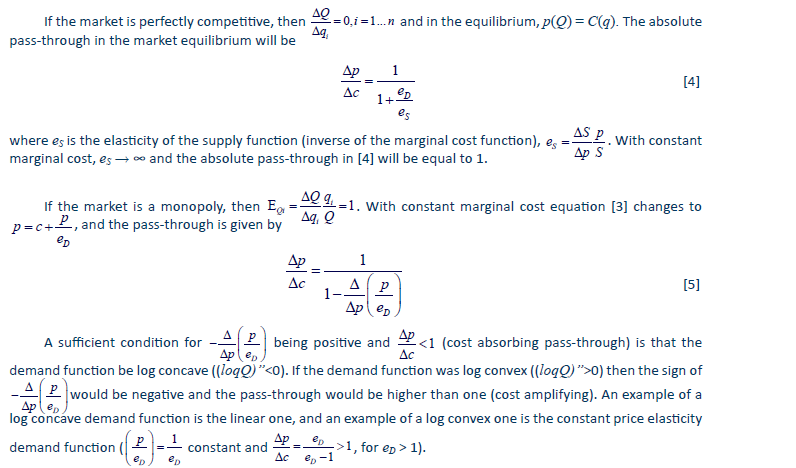
In perfectly competitive markets, the market power parameter k will be equal to one: firms are price takers and set output levels at profit maximizing values for which marginal production cost is equal to market price; with free entry, the marginal cost and the market price will also be equal to the minimum average cost in the equilibrium, and all firms in the market will earn zero economic profits. Therefore, k=1 (Lerner index equal to zero) is taken as the benchmark for the output levels in perfectly competitive markets where firms are price takers. Similarly, values of k higher than one will be indicative of firms with power to influence the market prices with their respective production decision; higher values of k will directly indicate higher market power of firms.
Equation [1] can be written as Price = k * Marginal Cost. If market power was independent of the marginal cost, relative changes in price over time would be equal to the sum of relative changes in market power plus relative changes in marginal costs:


The implication from [2] is that if market power stays constant over time, the relative change in price (price inflation) from period t to t+1 would be equal to the relative change in marginal cost during the same time interval (cost inflation). However, a necessary condition for this result to hold is that market power being independent of the marginal cost. Alternatively, firms may use their market power somehow arbitrarily and, particularly in periods of high cost inflation as the present one, contribute to price inflation beyond the caused by cost inflation by increasing the mark up, which is the same that increasing profit margins (profit-driven inflation). For many analyst, the increase in the share of profits in the gross value added of developed economies in 2022, coinciding with a fall in labour share, is explained as direct consequence of the exercise of market power of firms that are able to increase profit margins and final prices independently of the increase in production costs. There are, however, other explanations of the evolution of the share of non-labour income in national accounts, different from firms exercising their market power, among them the different evolution of the marginal and of the average unit labour costs in many economies during the pandemic period 2020-2022 (Salas-Fumás, 2023). And, more importantly, equation [2] is derived from the definition of market power, and not as a market equilibrium result from firms competing with each other.
Price formation in markets with profit maximizing firms
Consider a market with n firms, each producing a quantity of output qi. Define the aggregate output measure by Q = Q(qi,q-i), where q-i is a vector of productions for firms different from i. Let, pi = pi (Q (qi,q-i)) be the selling price of firm i, and Ci (qi) the total variable production cost of the same firm. The profit maximizing conditions for the n firms imply,

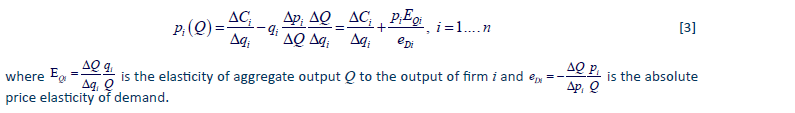
The pass-through that captures the adjustment of price to exogenous changes in the production cost would have to be calculated from the total simultaneous total differentiation of both sides of equation [3] for the n firms in the market. For the general formulation of the problem, a closed calculation of the pass-through is not possible. The condition of symmetry across firms makes the problem tractable. The symmetry condition would hold in an oligopoly market where equally productive efficient firms (same production cost) produce and sell a homogeneous product. In this situation, Q = nq and p = p (Q).
Relative pass-through
In the study of the relationship between cost and price inflation, the relevant pass-through is formulated in relative terms: relative change in cost that is passed-through to relative change in price:  . Since
  is the measure of market power,
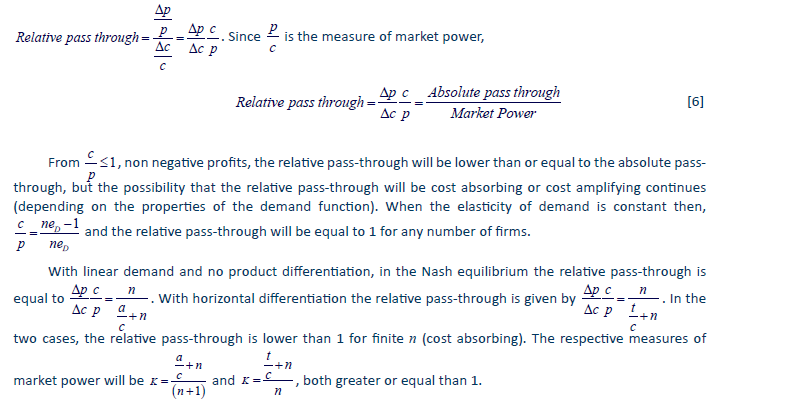
The relative pass-through increases with n and decreases with t, while market power decreases with n and increases with t. This implies that market power will decrease with market structure variables that get closer to those of perfect competition (higher number of firms and lower horizontal differentiation), just the opposite to what happens with the relative pass-through: increases with n and decreases with t. The relative pass-through will be higher in markets with structural conditions closer to those of perfect competition, i.e., higher in markets where lower market power of firms. Moreover, in general, market power will not be independent of the relative pass-through. In fact,
3. DESCRIPTION OF THE DATA SAMPLE AND MAIN VARIABLES OF THE SURVEY
The sample
The data used in the empirical study were collected by the Instituto Aragones de Fomento, IAF, as part of the Business Barometer that regularly surveys firms located at the Autonomous Community of Aragón (Spain). The purpose of the Barometer is to follow up the business activity and provide timely input information for better tuning of the regional government programs aimed at supporting the firms in the region. Complementarily, each wave of the Barometer includes questions on the firms’ perceptions about impacts, threats, opportunities, responses… of external shocks at the time of the survey: COVID-19 (April 2020), economic recovery (February 2021), and the last one, in November 2022, inflation.
The target population of the Barometer includes 6,622 firms of all sizes and from all economic sectors that have maintained and still maintain relationships with the IAF as suppliers and as customers of the agency’s regional and business development programs. All firms received a mail from the IAF explaining the content and motivation of the survey, and inviting them to voluntarily and anonymously (if they wish so) respond to the questions of a survey, accessible through a link included in the message. The online survey was open for firms to respond during three weeks, from November 8th to November 28th, 2022. The estimated response time was approximately 30 minutes. The rate of response has varied across barometers. This time, of the total number of firms invited to participate, 753 clicked the link to access the survey while 499 of them completed the survey with usable information. There are approximately 90,000 firms in Aragón (including the self-employed), so with a confidence level of 95%, the sample of 499 firms is representative of the population with a range of error of +/- 4.73%.4 There are indicators that show that the economic specialization of Aragón is representative of that of the whole country (Laborda et al., 2021).
Table 1 shows the distribution of the firms in the final sample across economic sectors. The first column corresponds to the sector distribution of the 499 firms; the second column to the sector distribution of the 466 firms that have complete data on prices and costs that are the main variables of interest in this study; the third column shows the distribution across economic sectors of total persons occupied in Aragón. Overall, the distribution of firms in the sample across economic sectors is reasonably close to the relative weight of the respective economic sector in the regional economy. Note also that the missing 33 firms, from the 499 usable responses to the 466 with complete information on prices and costs, are randomly distributed across sectors.
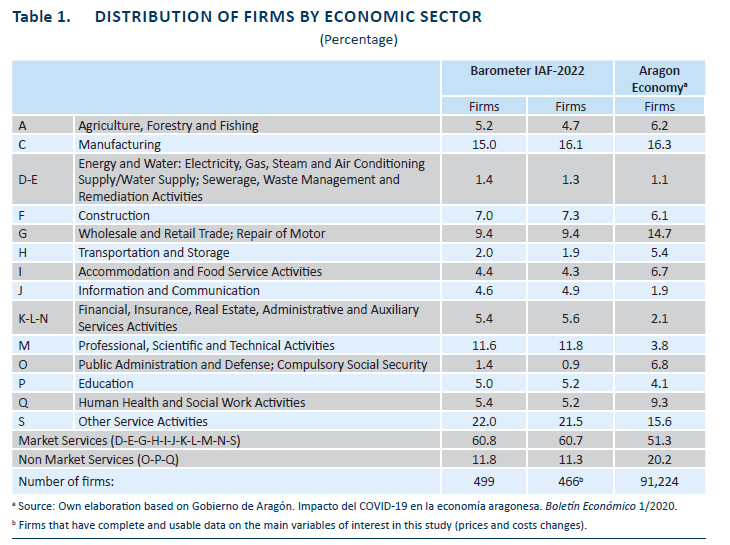
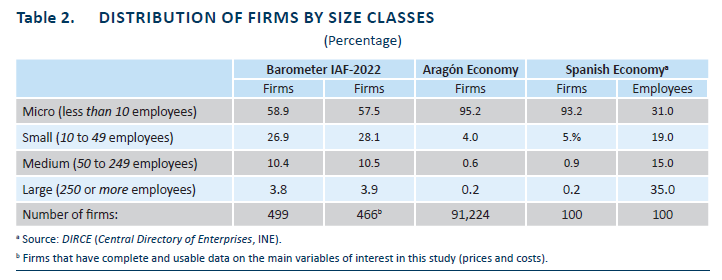
Table 2 shows the distribution of firms across size classes, micro (0 to 9 employees), small (10 to 49 employees), medium size (50 to 249 employees) and large (250 or more employees) firms. For each size class, the table shows the distribution across size classes of all firms in Aragón and the distribution of all occupied employees across size classes in Spain. Clearly, micro firms are underrepresented in the sample, mainly because of the large number of solo self-employed in this size class. If the proportions are recalculated only for the other three size classes, the size distribution of firms in the sample is more similar to the size distribution of the population of firms. The 33 firms with missing data on costs or prices tend to concentrate in the size class of micro firms.
Content of the survey
One block of questions asked firms about the evolution of their costs, prices and profit margins in 2022 with respect to 2021, and prospects for 2023 with respect to 2022. The survey asked respondents to choose one of the three possible time evolutions of cost and price: decrease, maintain or increase. Next, firms with changes in costs and prices were asked to report the percentage year change in the respective variable on a predetermined binned scale. Additionally, all firms were asked for the percentage change of profit margins in the respective time period. Firms were also asked for the importance, on a scale from 0 (not important) to 10 (very important), of a list of possible reasons for the cost increases and of possible reasons for their price decisions.
A second block of questions asked firms to score on a scale from 1 (highly negative) to 7 (highly positive) the estimated impact on their activity of variables from the general environment of the business, such as inflation and economic growth. For the empirical analysis, the variables were codded into two categories: negative (scores 1, 2, 3, 4) and neutral or positive (scores 4, 6, 7).
One variable of the market environment of the firm particularly relevant for this study was market competition. Firms were asked about their perception of whether the competitive conditions in their market were more or less favourable for them on a scale from 1 (very unfavourable) to 7 (very favourable). Again, the variable was codded into two categories, considering that unfavourable conditions meant high competition (responses 1, 2, 3) and more favourable conditions meant low competition (responses 4, 5, 6, 7).
The survey contained additional information on variables that capture the heterogeneity among the firms in the sample. One subset of firm-level variables refers to their individual characteristics, such as internationalization (yes or no of being exporters or importers), growth prospects (capital investment), and vulnerability to external shocks (percentage decrease in sales that would be critical for their survival, with lower absolute value percentage implying higher vulnerability). Another dimension of the heterogeneity had to do with the policy decisions that firms made in response to the external shock. Firms select one value on a scale from 0 (not important) to 10 (very important) for each of the following business policy decisions: development of new products and new markets, reduction of production, improvements in productivity, and renegotiation of debt.
4. DESCRIPTIVE INFORMATION ON THE VARIABLES
Changes in costs and the decision to maintain or to increase price
Table 3 shows the distribution of the 466 firms according to the evolution of their respective costs and prices in the two periods. In 2022, compared with 2021, 93% of the firms in the sample respond that their costs have increased; 6.7% respond that their costs have been the same; and only 2 firms (0.2% of the sample) respond that their costs have decreased. For the following year, the cost prospects are somehow better, as 72.3% of the firms expect cost increases, 24.2% expect that costs will not change, and 3.4% expect that cost will decrease. Considering that practically all firms acknowledge cost increases in 2022, the conclusion is that firms went through an episode of cost inflation during that year. Almost three-fourths of the firms expect that cost inflation will continue in 2023.
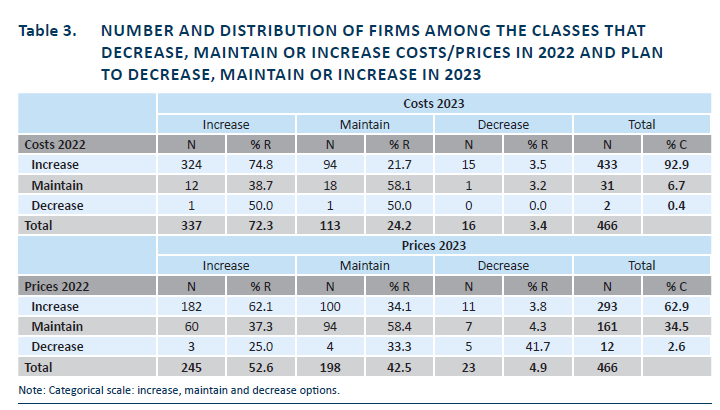
Firms could respond to the changes in costs by decreasing, maintaining or increasing their respective prices. From Table 3, in 2022 with respect to 2021, 62.9% of the firms in the sample answer that they have increased prices; 34.5% that they have maintained prices; and 2.6% respond that their prices decreased. Regarding the expectations for 2023 with respect to 2022, the proportion of firms that expect to rise prices decreases to 52.6%, while the proportion of firms that expect to maintain prices increases to 42.5%; 4.9% of the firms in the sample expect to decrease prices in 2023 with respect to 2022. Although the proportions of firms that increase prices or expect to do so in the two-year period are lower than the proportions of firms that experience cost increases, there are more than 60% of firms in the sample that will increase their prices in 2022, and more than 50% that expect to do so in 2023. Consequently, the evidence suggests be that price inflation goes together with cost inflation.
The data allow us to examine the time persistence in the evolution of costs and prices over time. Among those firms whose costs increase in 2022, three-fourths anticipate cost increases in 2023, while 21.7% expect that their cost will be maintained in 2023 with respect to 2022. From what is expected to happen in 2023, 96.1% of the firms that expect that their cost will increase in 2023 also experienced cost increases in 2022. With respect to price persistence, 62% of the firms that increase prices in 2022 expect that they will increase prices again in 2023; 34% of the firms that increase prices in 2022 expect to maintain them in 2023. Among those firms that expect to increase prices in 2023, 74.3% also increased their prices in 2022. The question of whether the cost increases are passed through to prices in the one-time period or whether the pass-through takes place over several periods of time will be investigated later.
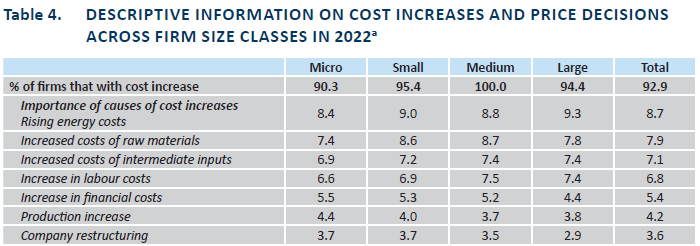
Table 4 provides information disaggregated by firm size classes about the causes behind the increase in costs and the reasons behind the decision to maintain or increase prices in 2022. The proportion of firms that experience an increase in cost during 2022 is close to 100% in all size classes; in all size classes firms coincide in the higher prices of energy, raw materials and intermediate inputs as the main reasons behind the cost increases. Labour costs contributed moderately to the increase in total costs, and financial costs contributed even less, according to the respondents of the survey (the increase in interest rates took place in 2022). The importance attached to the factors behind the cost increases is similar across size classes, although it is worth observing that the effect of financial costs decreases as the size of the firm increases, while that of labour costs increases with the size of the firms.
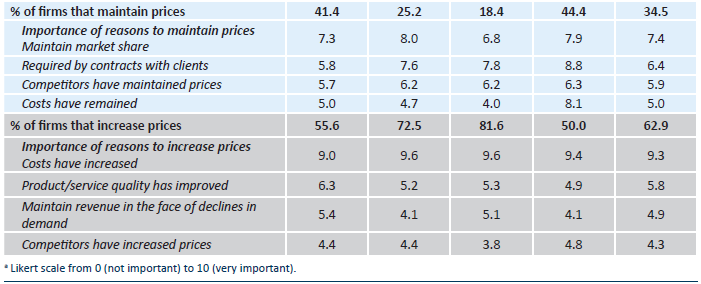
For the decision to maintain or to increase prices, the proportion of firms that did so varies across firm sizes. Micro- and large firms have a higher (lower) propensity to maintain (increase) prices than small- and medium-sized firms. The main reason behind the decision to maintain prices is to protect the market share, with similar weight across all size classes. The second reason in importance was contractual restrictions, although this reason increased in importance from smaller to larger size classes of firms. Among the large firms, the reason for maintaining prices because prices did not change was significantly more important than among the rest of firms. Finally, the main reason to increase prices across firms of all size classes was, by far, that costs increased, which confirmed that cost and price inflation were closely linked in 2022.
Rates of change of costs, prices and margins
The distribution of firms (proportions) across bins of rates of change for cost, price and margin for the years 2022 and 2023, as well as averages of rates of change in costs and prices across size classes, are reported in Table 5.
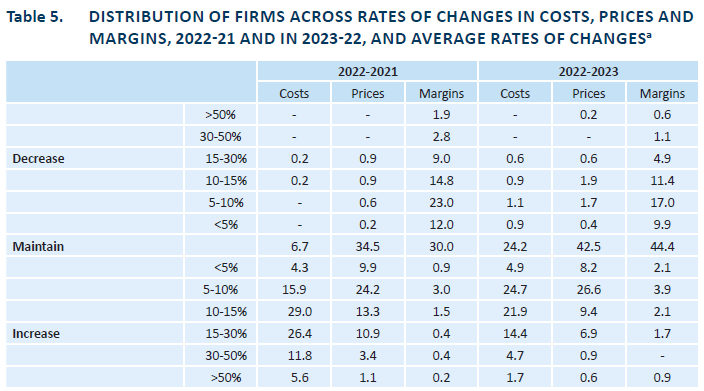
The average rates of cost increases were 18.9% in 2022 and 10.5% (estimated) in 2023. The average rate of change for the subset of firms that experience an increase in costs was 20.4% in 2002 and 15% in 2023. The averages are more similar between the two groups of firms in 2022 than in 2023, The reason was that in 2023, there are fewer firms that expect cost increases than in 2022. The expectation of lower cost inflation in 2023 than in 2022 is also evident when comparing the proportion of firms that experience or expect an increase in costs of 30% or higher: 17.3% in 2022 and 6.4% in 2023.
The average rate of change in price in 2022 was 7.9%, similar to the median of the distribution, between 5% and 10%. In 2023, the average price increase (expected) is 5%, higher than the median, <5%. In the upper tail of the distribution of price changes, in 2022 (2023) only 4.5% (1.5%) of the firms increase prices 30% or more. The differences between the average increase in cost and the average increase in price continue when the comparison is restricted to the subsamples of firms that increase costs and that increase prices. The average rates of price changes are lower than the average rates of cost changes. Consistently, the profit margins of firms in the sample decrease in 2022 and 2023, respectively, -7.3% and -3.4%, on average. The firms in the sample, contemporarily, translate cost increases to price increases only partially; in the short term, they estimate that cost and price inflation will result in lower profit margins in 2022 with respect to 2022, and in 2023 with respect to 2022.
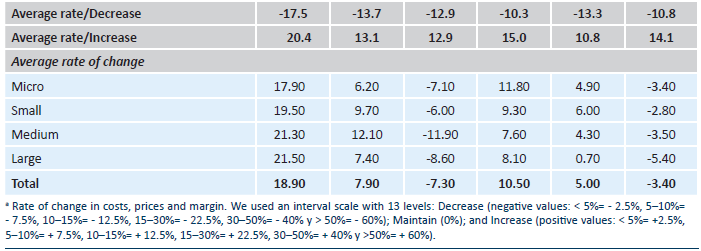
Summary information on the rest of the variables
Table 6 provides descriptive information on the rest of the variables selected to capture the heterogeneity among the firms in the sample. Approximately one-third of the firms consider that the competition conditions are unfavourable, a situation that will be interpreted as an indication of operating in a market environment of higher competition. The proportion of firms that value inflation and economic growth expectations as unfavourable clearly dominates over those that value them as favourable. More than one-fourth of the firms in the sample export and more than one-third import. Firms give more importance to market and product development, and to increases in productivity than to reducing production and renegotiating debt, as policy decisions in response to the external shocks. On average, approximately a 30% decline in sales would be sufficient to cause serious viability problems for the firms in the sample. Around one-third of firms expect to increase gross capital formation in the period, with an average annual rate of increase of 2.9%.
5. THE PASS-THROUGH OF COST CHANGES INTO PRICE CHANGES
Empirical models from price formation under imperfect competition
The theory on price formation in section two above establishes a relationship between cost and price inflation that can be estimated with the data available on changes in costs, in prices and in margins. The empirical model includes a regression and a selection equation (Heckman, 1979):
Regression equation:

Selection equation:

The error terms are distributed as follows: ϵit~N(0,σ), εit~N(0,1), corr(ϵit, εit) = ρ
The regression equation explains the rate of change in price by firm i in period t as a function of the rate of change in costs for that firm also in period t, plus a vector of observable variables, Xit that control for the heterogeneity of firms in the sample: sector of activity, size class, perception about the environment, prospects for economic growth, vulnerability, business decisions; ϵit is the random error-term. The parameter β to be estimated will give a measure of the elasticity of price changes to cost changes. According to the theory, the estimated parameter must be positive, but can be greater or lower than one. The vector of parameters γ will provide estimates of differences in relative price changes attributed to differences in the values of the control variables across firms in the sample.
The selection equation takes into consideration that the relative change in price is preceded by the explicit decision by each firm to increase the price (value of Increase priceit = 1) or not (Increase priceit = 0). This decision is modelled as a function of the Cost increase variable (which takes the value of 1 if the firm reports an increase in cost in the period and zero otherwise) and of other variables Zit that also capture the heterogeneity among firms, many of them common to vector Xit; εit is the random error term. The paramter α should be expected to be positive (a higher likelihood of increasing prices when costs increase); the parameters in the vector φ measure the effect of the rest of the explanatory variables on the decision to increase prices or not. The selection and the regression equations together imply that the latter is restricted to positive values of the dependent variable, i.e., restricted to observations from firms that increase prices in the respective time period. The number of observations with price decreases in the sample is too small to formulate and estimate a separate model to explain price decreases as well.
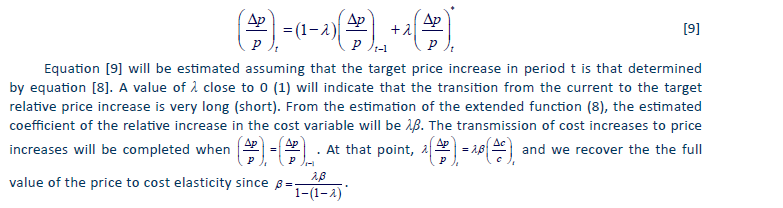
The empirical model will be first estimated pooling the two-year data, and second with data only for 2023 and including price changes in 2022 (lagged price changes) as an additional explanatory variable. The formulation of the dynamic model is based on the assumption that the transmission of cost increases to price increases is done gradually over time, perhaps because of adjustment costs. Then, the observed difference in the change in prices between two periods will be just a proportion λ of the distance between the target and the current price change:

where * is the target value of the price change in period t. The equation can be rewritten as

The static and dynamic formulations of the empirical model will be estimated with two specifications. One will estimate an average elasticity of price to cost changes, common to all firms in the sample; the other will allow for differences in the elasticity of relative price to relative cost changes for firms that perceive high competition in their product market, than for firms that perceive low competition (competition variable). In the dynamic formulation, differences will also be allowed in the speed of price adjustment between firms in high and firms in low-competition environments.
Results of the estimation average pass-through of cost changes
The results of the estimations of the empirical model (8), with Heckman’s two-step estimation method and the pooled data for the years, 2022 and 2023, are presented in Table 7. The statistical significance of the coefficient of the Mills ratio lambda (p<1%) justifies the joint estimation of the selection and regression models.
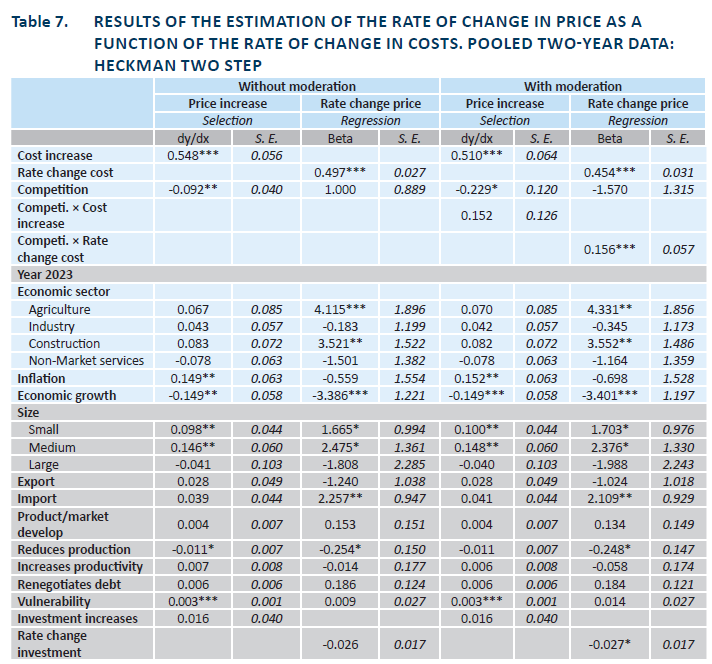
The estimated coefficient of the cost increase variable in the selection equation, 0.548, margin effect, indicates that the probability of an increase in prices is 0.548 higher for firms that experience a cost increase than for those which do not experience it. The next result in Table 7 is that firms that perceive high market competition are less likely (probability 0.092 points lower) to increase prices than firms that perceive low competition, controlling for the cost increase and for the other explanatory variables in the selection equation.
For the rest of the explanatory variables, firms with the worst inflation prospects are more likely to increase prices than firms with more positive prospects. Firms with better prospects for the growth of the economy are also more likely to increase prices than firms with the worst prospects (the estimated coefficient has a negative sign because the 1 value of the dummy variable is assigned to firms with the worst prospects for economic growth). The positive and statistically significant estimates of the small and medium-sized firms confirm the descriptive information in the sense that they have a higher propensity to increase prices than micro and large firms. Finally, the variable reduce production lowers the likelihood of price increasing, while the vulnerability of the firm is positively associated with the decision to increase prices.
The results of the regression equation show an estimated elasticity of price to cost changes equal to 0.497, significantly positive but less than one. This means that, on average, the firms in the sample will translate into a relative increase in prices approximately half of the relative increase in costs. Controlling for the rest of the explanatory variables, the average rate of increase in prices will be 4.115 percentage points higher among firms in agriculture than among firms in the industry and service sectors. Similarly, Construction firms increase their prices, on average, 3.584 percentage points higher than firms in Industry and Service. The average rate of increase in prices is 3.386 percentage points higher among firms that have high expectations of economic growth than among firms that have low expectations of economic growth. Small- and medium-sized firms show higher average rates of increase in prices than micro and large firms, respectively, by 1.665 and 2.475 percentage points. Firms that import, on average, show a rate of increase in prices 2.257 percentage points higher than firms that do not import. Finally, the higher the importance of reduction in production as the response of firms to current perturbations, the lower the rate of increase in prices (estimated coefficient -0.254).
The last two columns of the table show the results of the estimation when differences are permitted in the estimated elasticity of price to cost changes in the subsample of firms that perceive a more intense level of competition in their product markets, and in the subsample of firms that perceive a less intense level of competition. The estimated elasticity of price to cost changes is 0.454, again greater than zero but lower than one, for firms that perceive low competition and 0.454+0.156=0.610 for forms that perceive high competition, still different from one. The difference of 0.156 is significantly different from zero and economically meaningful. The results of the estimation for the rest of the explanatory variables are maintained.
Results of the estimation: Dynamics in the pass-through of cost changes
The results of the estimation of equation [9] are presented in Table 8. The estimated coefficient of the variable price increase in 2022 (t-1) in the selection equation is positive and statistically significant: firms that increase their price in 2022 have a probability of increasing price in 2023, 0.291 points higher than firms that did not increase price in 2022. The estimated coefficient of the variable cost increase in 2023 is 0.516, which is significantly different from zero. Its long-term value is 0.516/(1-0.291) = 0.728. Therefore, in the long term almost three out of four firms that increase cost will also increase prices.
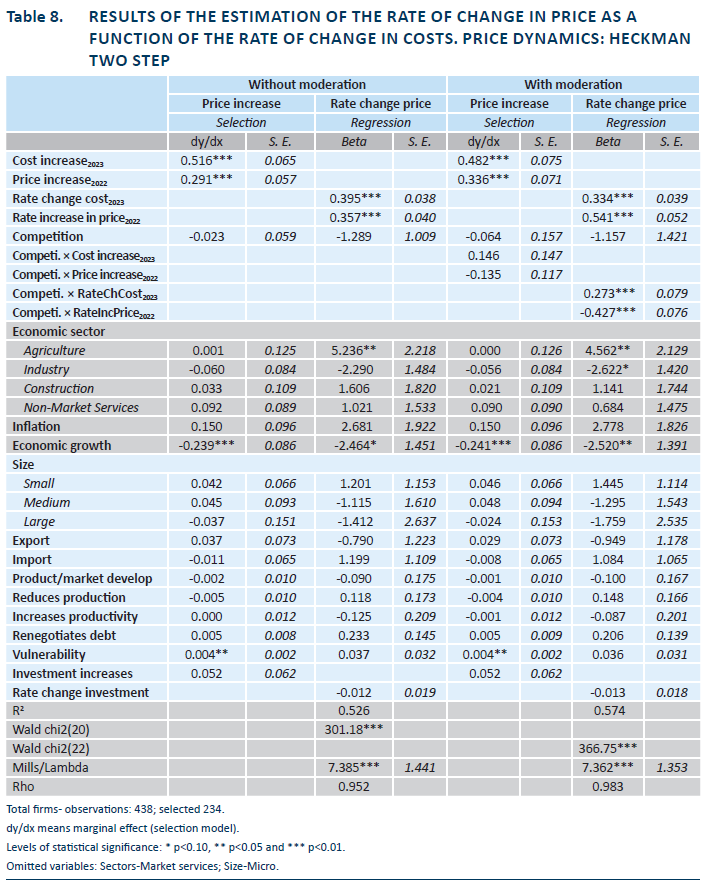
Two other explanatory variables have a significantly different from zero estimated coefficient, economic growth (negative) and vulnerability (positive). From the way the variable is defined, firms more optimistic about the growth of the economy (maybe because they anticipate good growth prospects for themselves) are more likely to increase prices, controlling for having experienced an increase in cost or not; increases in the vulnerability of firms result in a higher probability of increasing prices, also in the long run. However, the differences in the propensity to increase prices among firms in high- and low-competition environments and the differences among firms belonging to different size classes are now not statistically significant.
The time dynamics in the pass-through of cost to price increases are also observed in the results from the estimation of the regression equation. The estimated coefficient of the explanatory variable lagged relative change of price (year 2022) is 0.357, positive and significantly different from zero. The contemporary elasticity of price to cost changes is 0.395, again positive and significantly different from zero. These two values imply a long-term elasticity of price to cost changes of 0.395/(1-0.357) =0.614; in other words, when the transmission is completed, 61.4% of the rate of increment in cost will be passed through in terms of the rate of increase in prices. As was the case in the static model of Table 7, firms in the agriculture sector and firms with higher expectations of economic growth experience a higher rate of increase in prices, controlling for cost increases, than firms otherwise.
Among the firms that respond that perceive low market competition, the short-term elasticity of price to cost increase is 0.334, and the long-term elasticity is equal to 0.334/(1-0.541)=0.727. Among firms that perceive high competition, the short-term elasticity is 0.334+0.274=0.608. Firms that perceive high market competition pass through the cost increases to price increases faster than firms that perceive low competition, as indicated by the lower estimated coefficient for the lagged price change variable in the former group of firms than in the latter, 0.541-0.425 = 0.112, significantly different from zero. Then, the estimated long-term elasticity of price to cost changes for firms that perceive high competition is 0.608/(1-0.112)= 0.69.
Direct estimate of the contribution of market power to price inflation
Therefore, under the theory of price formation outlined in section two above, cost inflation will result in generalized increases in profit margins when market conditions that favour relative cost amplifying pass-through dominate over the market conditions that favour relative cost absorbing pass-through.
On the other hand, when firms can somehow arbitrarily rise profit margins in addition to cost increases in the formation of prices, the relative change in prices can be written as:

Equation [11] implicitly assumes that firms experience an increase in cost and, independently, they choose the increase in profit margin so that the two together will determine the increase in price (profit-margins driven inflation).
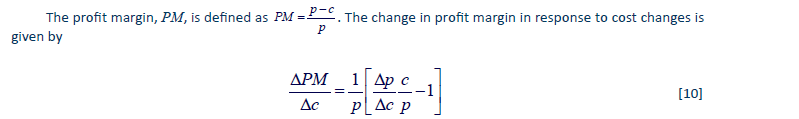
The two formulations of price formation proposed to explain the relationship between cost and price inflation, the cost-driven inflation where the pass-through depends on market competition conditions, and the profit-margin driven price inflation) imply different empirical predictions on the determinants of changes in profit margins. If the relative change in price is determined as a function of the relative change in costs, as prescribed from the theory of price formation in the Nash equilibrium of imperfect competition then, when controlling for cost increases, the change in profit margin should be independent of the relative change in price. However, if there is something other than what is predicted by the theory of pass-through in the formation of prices, the change in the relative profit margin will depend on the relative change in price, even when controlling for the cost increases.
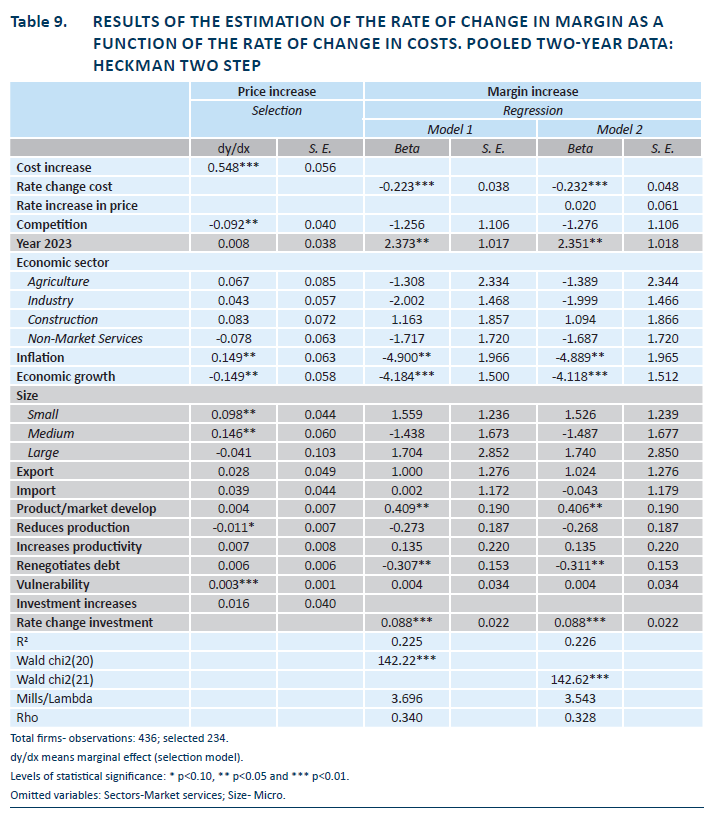
Table 9 shows the result of the estimation of the change in the relative profit margin of firms as a function of cost and price changes, with the pooled two years of data. The selection equation in the two step estimation explains the decision of firms to increase prices or not. The results show, first, that the coefficient of the Mills lambda is not statistically significant, which means that the decision to increase price or not appears to be independent of the evolution of the profit margin, controlling for the rest of the explanatory variables, including cost changes. Second, in the regression equation, the elasticity of profit margin to changes in costs is negative and statistically significant, consistent with equation [10]. Third, controlling for cost changes, the estimated coefficient of price changes in the regression equation is not significantly different from zero, which would reject the hypothesis of firms exercising market power beyond what is allowed by market competitive conditions.
6. DISCUSSION OF THE RESULTS
The evidence extracted from survey data collected from a sample of Spanish firms during the inflationary episode in 2022-2023, presented in the previous sections, draws to the conclusion that price inflation has been the consequence of cost inflation from rises in energy and other imported intermediate input prices. The average elasticity of price to cost increases estimated from the data is less than one, i.e., the relative pass-through is cost absorbing. This result would be consistent with predictions form the theory of price formation in markets with profit maximizing firms competing a la Nash, and where the dominant forms of demand functions are log-concave, for example quantity demanded linear and decreasing function of the market price. The pass-through is cost absorbing, i.e., firms reduce their profit margins in the market equilibrium. This happens because, if the relative cost increase was totally passed through to price increases, the resulting decrease in revenues from lower demand would be more important, in absolute terms, than the gain from increasing per unit profit margins. Consistent with differences in the penalties from price increases in the form of lower demand –higher in markets where the competition is weaker–, the estimated relative pass-through estimated from the data is lower among firms in less competitive markets than among firms that perceive their markets as more competitive.
The results from our analysis would be consistent with those of Genakos and Pagliero (2022), who estimated an absolute pass-through of cost changes to price changes in the range between 0.44, when the firm is a monopolist in its market, to 1, when the number of competitors in the market is four or more. However, the estimated pass-through values are not directly comparable between the two papers because, first, we estimate relative pass-through, not an absolute one; and second, in this paper we do not have hard data on market structure and competition variables –such as the number of competitors in the market– and must rely on subjective perceptions of firms in the sample about the competition conditions of their product markets.
Another finding of this paper is that, controlling for cost changes, the changes in profit margins were not correlated with changes in selling prices. This means that that prices did not contain information about the changes in the profit margins, additional to that already contained in the cost changes. Conlon et al. (2023) also reject the hypothesis that price changes have had an effect on mark-up changes, when controlling for cost changes, with US firms’ level data in the period 2018: Q1 to 2022: Q3. Therefore, the results of the analysis do not support the hypothesis of profit-margin driven inflation, according to which firms exercise their market power to increase prices separately from cost increases and as if demand would not be affected by the price rises.
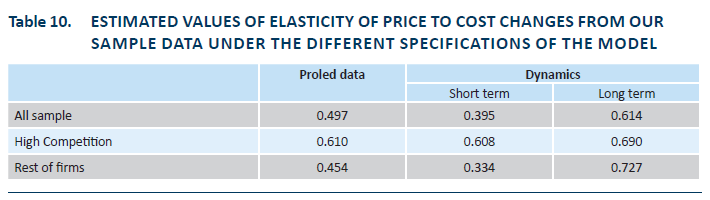
The results from the estimation of the dynamic formulation of the model to estimate relative pass-through, although limited because the data available cover only two years, support the hypothesis that firms spread the transmission of cost increases to price increases over several periods of time (relative price increases in period t depend on relative price increases in period t-1, in addition to the dependence on contemporary cost increases). The speed in the transmission is shorter in the sample of firms that perceive an environment of high market competition than among those that perceive an environment of low competition. The evidence is consistent with the findings of Gopinath and Itskhoki (2010) and Genakos and Pagliero (2022). Table 10 summarizes the estimated elasticities of price to cost changes from the sample data, with the different specifications of the empirical model. The estimated elasticity values in Table 10 are not directly comparable with the pass-through values estimated in other papers for at least three reasons: the elasticity estimated here corresponds to a relative pass-through, while most of the papers estimate absolute pass-through; the two steps estimation method used here is not the common one in the literature; the data used in the estimation is collected through a survey that respond firms from many different economic sectors, while other papers use data restricted to homogeneous products in particular markets (gasoline in the case of Genakos and Pagliero (2022); cement in the case of Miller, Osborne and Sheu (2017)).
Other results from the estimation
Although the main interest of this study is to estimate the elasticity of price to cost changes and test which hypothesis, cost inflation or profit-margin inflation was more consistent with the evidence, there are findings from the research that are worth to recall. In the estimation of the selection equation with the pooled data, Table 7, the estimated negative and statistically significant coefficient of the competition variable, -0.092, indicates that controlling for the situation of experiencing a cost increase or not, as well as for the rest of the explanatory variables, firms that perceive a highly competitive environment have a probability of rising prices 0.092 points lower than firms with low perception of competition. Therefore, the perception of high competition leads firms to delay the decision to pass through cost increases, compared with firms with other perceptions but once the decision is made to increase prices the relative pass-through is higher and the transmission of cost increases is done in a shorter period of time.
Firms that anticipate higher inflation (have more negative prospects on the evolution of the variable) have higher propensity to increase prices than firms more optimistic about the evolution of general inflation. Perhaps the expectation of an environment of high inflation motivates firms to raise prices above what would be expected from the rise in costs, with the expectation that the decision will be disguised and undetected by buyers and by competition authorities (OCDE, 2022). Similarly, firms more optimistic about the evolution of general economic growth show a higher propensity to increase prices than firms otherwise; the reason could be that the positive expectation on the evolution of aggregate demand will counterbalance the negative effect of higher prices in the own demand.
We have no a priori explanation for why small– and medium-sized firms have a higher propensity to increase prices, ceteris paribus, tan micro– and large firms. The negative effect of the intensity of production reductions in the propensity to increase prices may be an indication that firms that reduce production wait more before they increase prices to soften the fall in demand that motivated the reduction of production, already underway. Finally, the positive association between vulnerability and propensity to increase prices could be explained by the fact that more vulnerable firms feel more pressured to rise prices as a way to protect from such vulnerability.
In the estimation of the regression equation with pooled data, the coefficients of the variables competition, inflation and vulnerability are not significantly different from zero. Therefore, these three variables affect the propensity to increase prices but not the amount of price increase beyond what it would recommend an increase in costs. In the regression equation, firms in the agriculture and construction sectors increase prices on average at higher rates than firms in other sectors, controlling for cot increases and for other explanatory variables. Again, we cannot think of economic reasons that can justify these sectorial differences in price increases.
The estimation of the model on determinants of changes in profit margins also shows some results worth mentioning. In particular, changes in profit margins are significantly higher on average in 2023 than in 2022, probably consistent with the continuation of the pass-through of cost increases in 2022 to price increases in 2023. Additionally, the changes in profit margins correlate positively with the intensity with which firms respond to external shocks with more intense product or market development and with the rate of growth in capital investment. Better prospects in profitability correlate positively with growth in product/market development and with growth in production capacity. All these results are consistent with what would be expected from rational behaviour and can be taken as evidence of the consistency and coherence of the sample data.
7. CONCLUSION
Cost inflation, rather profit margin inflation in a more accurate explanation of the price inflation episode in Spain during 2022-2023, according to the results of the analysis presented here. The adjustment of prices to changes in costs observed in the data can be explained by the theory of price formation in imperfectly competitive markets where profit maximizing firms follow a Nash competitive behavior (firms decide as if their decisions were not going to affect the decisions of the competitors). The competitive conditions of the market affect the magnitude and speed of the relative pass-through of cost increases to price increases. Market power is not an input in the price formation process but rather a market equilibrium outcome that also depends on the market competitive conditions. Not only there is no evidence of profit-margin driven inflation in the data, but the results indicate that during the recent inflation episode, profit margins and market power have decreased, according to the evidence of an average relative pass-through lower than one.
Strong market competition has many positive efficiency and income distribution effects. Competition will foster product and process innovation that, in turn, will increase the value of goods and services produced, relative to their respective production costs; furthermore, the gains will be passed through to final consumers in the form of lower prices. However, competition and competition policy will not be an effective remedy to contain price inflation in a situation of generalized cost inflation, as the one the world economy is going through. The reason is that competition assures that the distance between the level of prices and the level of costs stays constant or decreases over time. However, for a given rise in costs, the proportion of that increase passed through as increase in prices will generally be higher for more structurally competitive markets. This means that, for a given cost inflation, price inflation -the relative increase in prices following an increase in costs-, will be higher in more competitive markets than in less competitive ones. The theory on the pass-through from costs to prices also suggests that the translation of taxes and subsidies will be faster and stronger in more competitive markets. When the relationship between competition and inflation is analysed over longer periods of time, the conclusion can be different because the effects of competition on the price level interfere with the results on the effects of competition on pass-through (Przybyla and Roma, 2005).
The data used in our analysis have some limitations, from the way that they were collected (voluntary online survey to a subsample of firms that collaborate with a regional government agency for economic development), and because it is limited to only two years. Additionally, the competition variable that is used to test the hypothesis that the elasticity of price to cost increases will be sensitive to market competition conditions is measured as a subjective perception of the person who responded to the survey, not with hard data, such as the number of competitors in the market. However, the results from the different estimations are quite coherent and consistent across them and in line with the results found in other papers published on this topic.
The micro foundations of price formation in imperfectly competitive markets are relevant for the right diagnoses of price inflation caused by cost inflation, but it is not comprehensive about the explanation of all causes of inflation. Competition policy will not realistically supplant monetary and fiscal policies in fighting inflation, although there will be complementarities factors among them. Interest rates and domestic wages are also part of production costs and will be inputs in the cost and price formation processes. The transmission of official interest rates to the cost of business finance and the transmission of agreements in wage increases between labour and business organization into labour costs, will be determined by the competition conditions in banking and in local labour markets. The analysis of pass-through could then be extended to jointly account for upstream and downstream transmission of cost and price shocks.
A comprehensive view of pass-through along the whole value chain will also be important to properly evaluate the distributional effects of cost-induced inflation, in particular the distribution of gross value added between salaries and profits. There is evidence that market power in final product and service markets correlates negatively with the labour share (Autor et al., 2020; De Loecker, Eeckhout and Unger, 2020; Kehrig and Vincent, 2021). However, the value added depends on the prices and quantities of imported inputs. If the elasticity of substitution between imported inputs and labour services is different than one, then the evolution of prices of imported inputs will affect the distribution of the value added, independently of market power (Castro-Vincenzi and Kleinman, 2022). As regards the cost of finance, higher official interest rates may lower profits in the credit market while increasing them in the market for deposits; consequently, to explain the profits of banks it will be important to model downstream and upstream pass-through of official interest rates. Something similar occurs in the energy markets, with the brent oil market effectively separating the price formation in extraction and in refining and distribution markets. All this means that cost formation should ideally be integrated as part of price formation instead of taking it as exogenously given as we do in this paper.
References
Autor, D., Dorn, D., Katz, L., Patterson, C. and Van Reenen, J. (2020). The Fall of the Labor Share and the Rise of Superstar Firms. The Quarterly Journal of Economics, 135, pp. 645–709.
Brauning, F., Fillat, J. L. and Joaquim, G. (2022). ‘Cost-price relationships in a concentrated economy’. Current Policy Perspectives. Federal Reserve Bank of Boston Research Department, 23
Cabral, M., Geruso, M. and Mahoney, N. (2015). Does Privatized Health Insurance Benefit Patients or Producers? Evidence from Medicare Advantage. Working Paper, 2015. https://papers.ssrn.com/sol3/papers.cfm?abstract_id=2489999
Castro-Vincenzi and Kleinman, B. (2020.) Intermediate Input Prices and the Labor Share. https://static1.squarespace.com/static/5fbd5c064c271a353f8a9840/t/6356d28b31815f2ea13c2f33/1666634394840/LaborShare.pdf
Conlon, Ch., Miller, N., Otgon, T. and Yao, Y. (2023). Rising Markups, Rising Prices? AEA Papers and Proceedings, 113, pp. 279-283. DOI: 10.1257/pandp.20231098
De Loecker, J., Eeckhout, J. and Unger, G. (2020). The Rise of Market Power and the Macroeconomic Implications. The Quarterly Journal of Economics, Vol. 135/2, pp. 561-644.
Diez, F. J., Duval, R. A., Shibata, I., Engler, P., Chen, M., Tavares, M., Maggi, C., Fan, Villegas-Sánchez, J. C. and Schwa, M. D. (2021). Rising Corporate Market Power: Emerging Policy Issues. IMF Staff Discussion Notes 2021/001. International Monetary Fund.
Fabra, N. and Reguant, M. (2014). Pass-through of Emissions Costs in Electricity Markets. American Economic Review, Vol. 104(9), pp. 2872–2899.
Genakos, C. and Pagliero, M. (2022), ‘Competition and Pass-Through: Evidence from Isolated Markets’. American Economic Journal: Applied Economics, 14(4), pp. 35–57.
Gopinath, G. and Itskhoki, O. (2010). Frequency of Price Adjustment and Pass-Through. Quarterly Journal of Economics, 125(2), pp. 675–727.
Heckman, J. (1979). Sample Selection Bias as a Specification Error. Econometrica, 47(1), pp. 53-161.
International Monetary Fund. (2019). The Rise of Corporate Market Power and Its Macroeconomic Effects., Chapter 2. World Economic Outlook.
Kehrig, M. and Vincent, N. (2021). The Microlevel Anatomy of the Labor Share Decline. The Quarterly Journal of Economics, 136, pp. 1031–1087.
Koltay, G., Lorincz, S. and Valletti, T. (2022). Concentration and Competition: Evidence from Europe and Implications for Policy. SSRN Electronic Journal. https://doi.org/10.2139/SSRN.4069206
Laborda, J., Rivera-Torres, P., Salas-Fumás, V. and Suarez, C. (2021). Is there life beyond the Spanish Government’ Aid to Furloughed Employees during the COVID-19? Plos One. https://doi.org/10.1371/journal.pone.0253331
Miller, N. H., Osborne, M. and Sheu, G. (2017). Pass-Through in a Concentrated Industry: Empirical Evidence and Regulatory Implications. RAND Journal of Economics, 48(1), pp. 69–93.
OECD. (2022). Competition and Inflation, OECD Competition Policy Roundtable. Background Note. www.oecd.org/daf/competition/competition-and-inflation-2022.pdf
Przybyla, M. and Roma, M. (2005). Does Product Market Competition Reduce Inflation? Evidence from EU Countries and Sectors ECB. Working Paper Series, 453.
Salas-Fumás, V. (2023). Inflación de Costes o Inflación de Márgenes Empresariales? Nota Técnica. Funcas, abril 2023.
Tirole, J. (1988). The Theory of Industrial Organization. MIT University Press.
Vernego, M. and Perez Caldentey, E. R. (2023). Price and prejudice: Reflections on the return of inflation and ideology. Review of Keynesian Economics. https://doi.org/10.4337/roke.2023.02.02
Weyl, E. G. and Fabinger, M. (2013). Pass-through as an Economic Tool. Journal of Political Economy, Vol. 121(2), pp. 528–583.
Notes
◆ Many thanks to Juan José Ganuza, Alfonso Novales, Jozsef Sakovics and Javier Vallés for their comments to first drafts of the paper. We acknowledge the financial support of MCIN/AEI/10.13039/501100011033 [PID2020-113338RB-I00]; and the Departamento de Ciencia, Universidad y Sociedad del Conocimiento del Gobierno de Aragón [S42_23R: CREVALOR]. Thanks also to the Instituto Aragones de Fomento, IAF, for the help in the collection of the data. The authors are the only responsible of the content of the paper.
* Professor University of Zaragoza.
** Emeritus professor University of Zaragoza and Funcas.
1 For more general evidence and explanations on the evolution of market power of firms over time see (De Loecker, Eeckhout and Unger, 2020; Diez et al., 2021; Koltay, Lorincz and Valletti, 2022; International Monetary Fund, 2019).
2 See for example the declaration of Canadian Competition Commission https://www.canada.ca/en/competition-bureau/news/2022/05/building-a-more-competitive-canada.html, and of the person responsible for competition policy in the EU, https://ec.europa.eu/commission/presscorner/detail/en/SPEECH_22_6067, on this respect.
3 For a more detailed exposition of the theory of price formation in imperfectly competitive markets see Tirole (1988).
4 A complete description of the survey can be found in https://www.iaf.es/lab-gestion-empresarial/